Czech vs Immigrants from Switzerland Disability Age 5 to 17
COMPARE
Czech
Immigrants from Switzerland
Disability Age 5 to 17
Disability Age 5 to 17 Comparison
Czechs
Immigrants from Switzerland
5.8%
DISABILITY AGE 5 TO 17
7.4/ 100
METRIC RATING
217th/ 347
METRIC RANK
5.2%
DISABILITY AGE 5 TO 17
99.8/ 100
METRIC RATING
61st/ 347
METRIC RANK
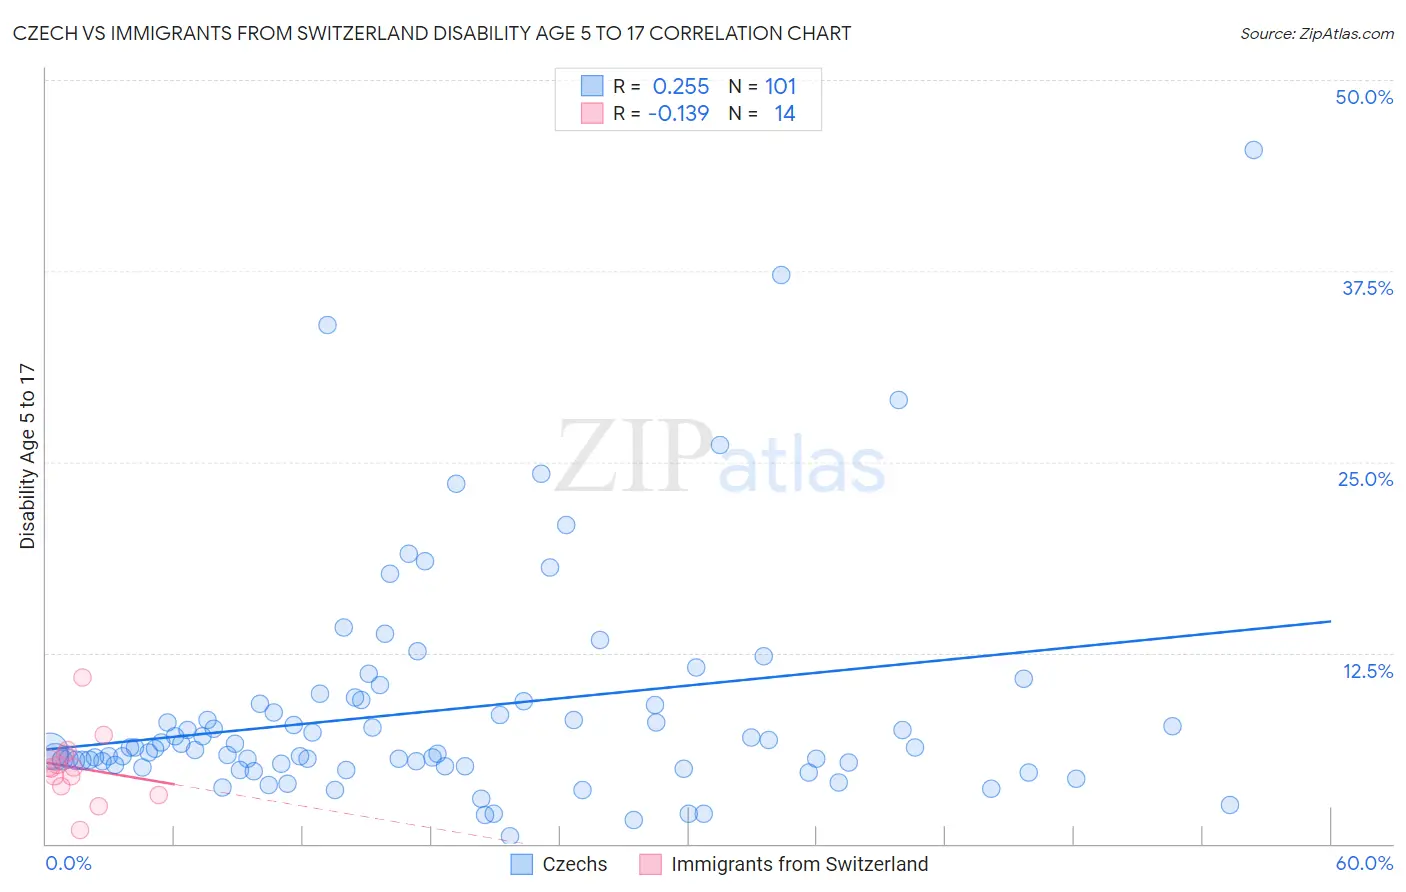
Czech vs Immigrants from Switzerland Disability Age 5 to 17 Correlation Chart
The statistical analysis conducted on geographies consisting of 477,643,997 people shows a weak positive correlation between the proportion of Czechs and percentage of population with a disability between the ages 5 and 17 in the United States with a correlation coefficient (R) of 0.255 and weighted average of 5.8%. Similarly, the statistical analysis conducted on geographies consisting of 147,257,747 people shows a poor negative correlation between the proportion of Immigrants from Switzerland and percentage of population with a disability between the ages 5 and 17 in the United States with a correlation coefficient (R) of -0.139 and weighted average of 5.2%, a difference of 11.8%.
Disability Age 5 to 17 Correlation Summary
| Measurement | Czech | Immigrants from Switzerland |
| Minimum | 0.52% | 0.94% |
| Maximum | 45.5% | 10.9% |
| Range | 44.9% | 10.0% |
| Mean | 8.8% | 5.0% |
| Median | 6.2% | 5.0% |
| Interquartile 25% (IQ1) | 5.1% | 3.8% |
| Interquartile 75% (IQ3) | 9.3% | 5.9% |
| Interquartile Range (IQR) | 4.1% | 2.2% |
| Standard Deviation (Sample) | 7.5% | 2.3% |
| Standard Deviation (Population) | 7.5% | 2.2% |
Similar Demographics by Disability Age 5 to 17
Demographics Similar to Czechs by Disability Age 5 to 17
In terms of disability age 5 to 17, the demographic groups most similar to Czechs are Nigerian (5.8%, a difference of 0.030%), Immigrants from Sierra Leone (5.8%, a difference of 0.050%), Sierra Leonean (5.8%, a difference of 0.060%), Belgian (5.8%, a difference of 0.080%), and Swedish (5.8%, a difference of 0.12%).
| Demographics | Rating | Rank | Disability Age 5 to 17 |
| Immigrants | Haiti | 9.5 /100 | #210 | Tragic 5.8% |
| Yugoslavians | 9.1 /100 | #211 | Tragic 5.8% |
| Immigrants | Panama | 8.7 /100 | #212 | Tragic 5.8% |
| Immigrants | Cameroon | 8.3 /100 | #213 | Tragic 5.8% |
| Immigrants | Morocco | 8.3 /100 | #214 | Tragic 5.8% |
| Swedes | 8.1 /100 | #215 | Tragic 5.8% |
| Nigerians | 7.5 /100 | #216 | Tragic 5.8% |
| Czechs | 7.4 /100 | #217 | Tragic 5.8% |
| Immigrants | Sierra Leone | 7.1 /100 | #218 | Tragic 5.8% |
| Sierra Leoneans | 7.0 /100 | #219 | Tragic 5.8% |
| Belgians | 6.9 /100 | #220 | Tragic 5.8% |
| Lithuanians | 6.7 /100 | #221 | Tragic 5.8% |
| Immigrants | Sudan | 6.7 /100 | #222 | Tragic 5.8% |
| Alsatians | 6.0 /100 | #223 | Tragic 5.8% |
| Mexicans | 5.7 /100 | #224 | Tragic 5.8% |
Demographics Similar to Immigrants from Switzerland by Disability Age 5 to 17
In terms of disability age 5 to 17, the demographic groups most similar to Immigrants from Switzerland are Immigrants from Ireland (5.2%, a difference of 0.090%), Immigrants from Bangladesh (5.2%, a difference of 0.20%), Immigrants from South Eastern Asia (5.2%, a difference of 0.23%), Immigrants from Greece (5.2%, a difference of 0.24%), and Palestinian (5.2%, a difference of 0.28%).
| Demographics | Rating | Rank | Disability Age 5 to 17 |
| Paraguayans | 99.9 /100 | #54 | Exceptional 5.1% |
| Laotians | 99.9 /100 | #55 | Exceptional 5.1% |
| Immigrants | Turkey | 99.9 /100 | #56 | Exceptional 5.1% |
| Immigrants | Poland | 99.9 /100 | #57 | Exceptional 5.1% |
| Immigrants | Ukraine | 99.9 /100 | #58 | Exceptional 5.1% |
| Immigrants | North Macedonia | 99.9 /100 | #59 | Exceptional 5.1% |
| Immigrants | Eastern Europe | 99.9 /100 | #60 | Exceptional 5.1% |
| Immigrants | Switzerland | 99.8 /100 | #61 | Exceptional 5.2% |
| Immigrants | Ireland | 99.8 /100 | #62 | Exceptional 5.2% |
| Immigrants | Bangladesh | 99.8 /100 | #63 | Exceptional 5.2% |
| Immigrants | South Eastern Asia | 99.8 /100 | #64 | Exceptional 5.2% |
| Immigrants | Greece | 99.8 /100 | #65 | Exceptional 5.2% |
| Palestinians | 99.8 /100 | #66 | Exceptional 5.2% |
| Macedonians | 99.8 /100 | #67 | Exceptional 5.2% |
| Immigrants | Syria | 99.7 /100 | #68 | Exceptional 5.2% |