Croatian vs Syrian Vision Disability
COMPARE
Croatian
Syrian
Vision Disability
Vision Disability Comparison
Croatians
Syrians
2.1%
VISION DISABILITY
92.3/ 100
METRIC RATING
114th/ 347
METRIC RANK
2.1%
VISION DISABILITY
87.5/ 100
METRIC RATING
133rd/ 347
METRIC RANK
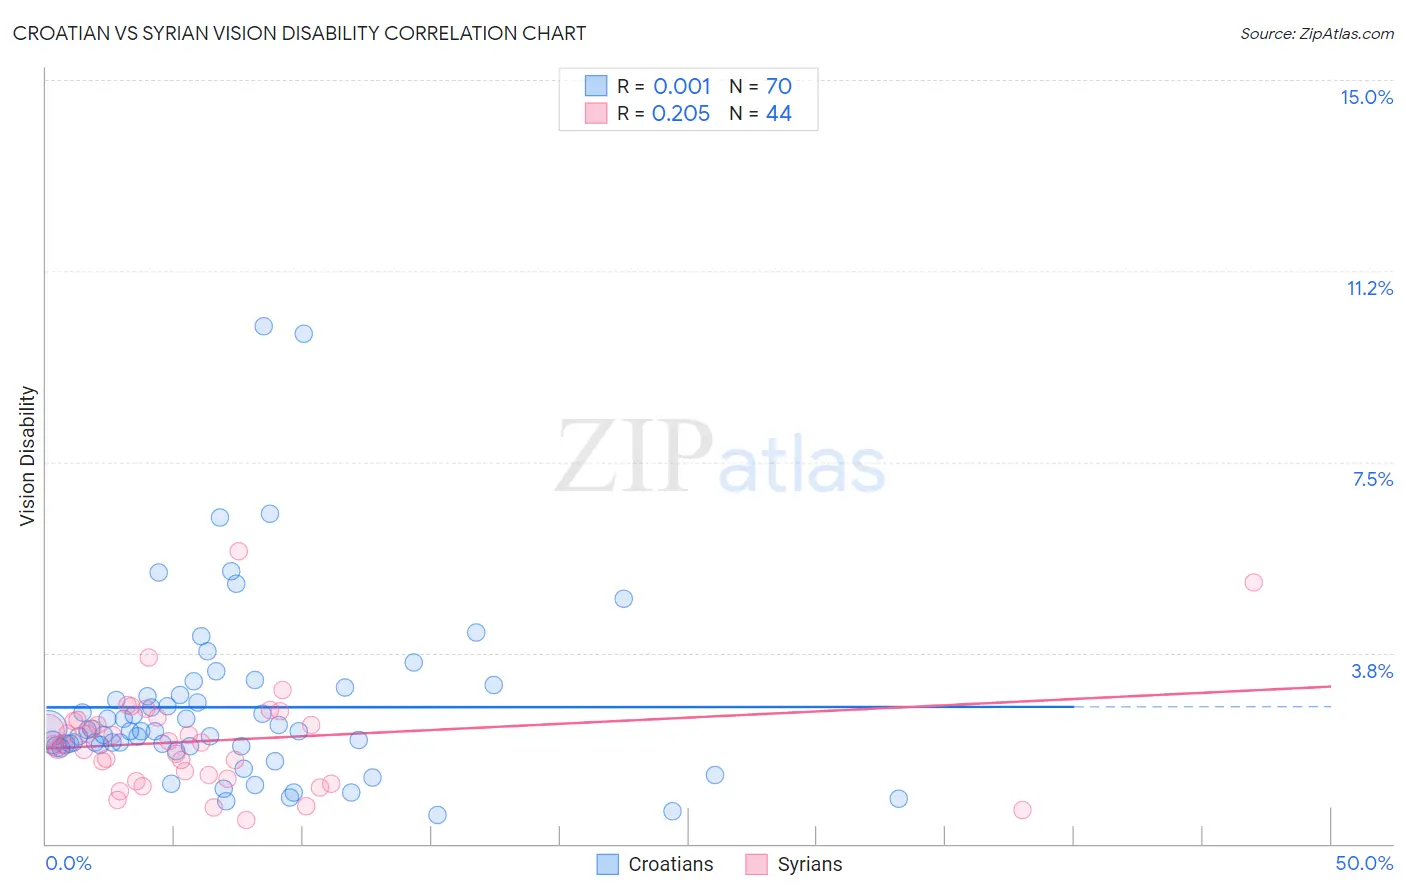
Croatian vs Syrian Vision Disability Correlation Chart
The statistical analysis conducted on geographies consisting of 375,377,812 people shows no correlation between the proportion of Croatians and percentage of population with vision disability in the United States with a correlation coefficient (R) of 0.001 and weighted average of 2.1%. Similarly, the statistical analysis conducted on geographies consisting of 266,224,532 people shows a weak positive correlation between the proportion of Syrians and percentage of population with vision disability in the United States with a correlation coefficient (R) of 0.205 and weighted average of 2.1%, a difference of 0.88%.
Vision Disability Correlation Summary
| Measurement | Croatian | Syrian |
| Minimum | 0.57% | 0.46% |
| Maximum | 10.2% | 5.8% |
| Range | 9.6% | 5.3% |
| Mean | 2.7% | 2.0% |
| Median | 2.2% | 2.0% |
| Interquartile 25% (IQ1) | 1.9% | 1.3% |
| Interquartile 75% (IQ3) | 2.9% | 2.4% |
| Interquartile Range (IQR) | 1.00% | 1.1% |
| Standard Deviation (Sample) | 1.8% | 1.0% |
| Standard Deviation (Population) | 1.8% | 1.0% |
Demographics Similar to Croatians and Syrians by Vision Disability
In terms of vision disability, the demographic groups most similar to Croatians are Immigrants from Vietnam (2.1%, a difference of 0.020%), Kenyan (2.1%, a difference of 0.030%), Ugandan (2.1%, a difference of 0.030%), Polish (2.1%, a difference of 0.070%), and Immigrants from Philippines (2.1%, a difference of 0.21%). Similarly, the demographic groups most similar to Syrians are New Zealander (2.1%, a difference of 0.10%), Immigrants from Hungary (2.1%, a difference of 0.17%), Immigrants from Kenya (2.1%, a difference of 0.18%), Immigrants from Cameroon (2.1%, a difference of 0.19%), and Immigrants from Chile (2.1%, a difference of 0.23%).
| Demographics | Rating | Rank | Vision Disability |
| Kenyans | 92.5 /100 | #113 | Exceptional 2.1% |
| Croatians | 92.3 /100 | #114 | Exceptional 2.1% |
| Immigrants | Vietnam | 92.2 /100 | #115 | Exceptional 2.1% |
| Ugandans | 92.2 /100 | #116 | Exceptional 2.1% |
| Poles | 92.0 /100 | #117 | Exceptional 2.1% |
| Immigrants | Philippines | 91.4 /100 | #118 | Exceptional 2.1% |
| Immigrants | Uganda | 91.4 /100 | #119 | Exceptional 2.1% |
| Immigrants | Zimbabwe | 91.0 /100 | #120 | Exceptional 2.1% |
| Immigrants | Scotland | 90.4 /100 | #121 | Exceptional 2.1% |
| Immigrants | Ukraine | 90.4 /100 | #122 | Exceptional 2.1% |
| Immigrants | Albania | 90.4 /100 | #123 | Exceptional 2.1% |
| Immigrants | Spain | 89.8 /100 | #124 | Excellent 2.1% |
| Immigrants | Venezuela | 89.8 /100 | #125 | Excellent 2.1% |
| Immigrants | Peru | 89.5 /100 | #126 | Excellent 2.1% |
| Sudanese | 89.2 /100 | #127 | Excellent 2.1% |
| Immigrants | Chile | 89.0 /100 | #128 | Excellent 2.1% |
| Immigrants | Cameroon | 88.8 /100 | #129 | Excellent 2.1% |
| Immigrants | Kenya | 88.7 /100 | #130 | Excellent 2.1% |
| Immigrants | Hungary | 88.7 /100 | #131 | Excellent 2.1% |
| New Zealanders | 88.2 /100 | #132 | Excellent 2.1% |
| Syrians | 87.5 /100 | #133 | Excellent 2.1% |