Hispanic or Latino vs Syrian Vision Disability
COMPARE
Hispanic or Latino
Syrian
Vision Disability
Vision Disability Comparison
Hispanics or Latinos
Syrians
2.6%
VISION DISABILITY
0.0/ 100
METRIC RATING
305th/ 347
METRIC RANK
2.1%
VISION DISABILITY
87.5/ 100
METRIC RATING
133rd/ 347
METRIC RANK
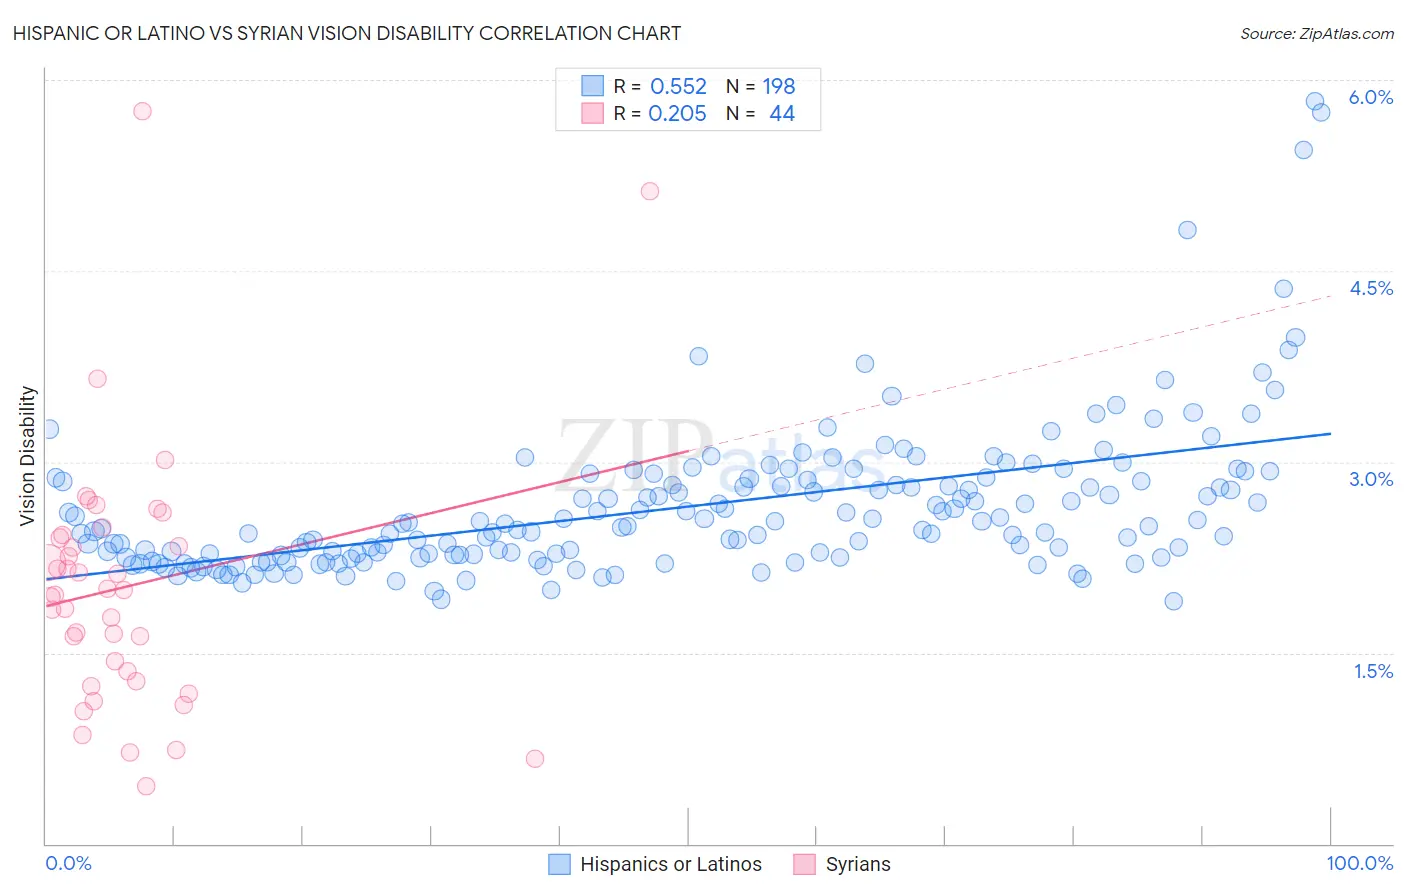
Hispanic or Latino vs Syrian Vision Disability Correlation Chart
The statistical analysis conducted on geographies consisting of 574,500,029 people shows a substantial positive correlation between the proportion of Hispanics or Latinos and percentage of population with vision disability in the United States with a correlation coefficient (R) of 0.552 and weighted average of 2.6%. Similarly, the statistical analysis conducted on geographies consisting of 266,224,532 people shows a weak positive correlation between the proportion of Syrians and percentage of population with vision disability in the United States with a correlation coefficient (R) of 0.205 and weighted average of 2.1%, a difference of 23.5%.
Vision Disability Correlation Summary
| Measurement | Hispanic or Latino | Syrian |
| Minimum | 1.9% | 0.46% |
| Maximum | 5.8% | 5.8% |
| Range | 3.9% | 5.3% |
| Mean | 2.6% | 2.0% |
| Median | 2.5% | 2.0% |
| Interquartile 25% (IQ1) | 2.3% | 1.3% |
| Interquartile 75% (IQ3) | 2.9% | 2.4% |
| Interquartile Range (IQR) | 0.59% | 1.1% |
| Standard Deviation (Sample) | 0.59% | 1.0% |
| Standard Deviation (Population) | 0.59% | 1.0% |
Similar Demographics by Vision Disability
Demographics Similar to Hispanics or Latinos by Vision Disability
In terms of vision disability, the demographic groups most similar to Hispanics or Latinos are Aleut (2.6%, a difference of 0.30%), Immigrants from Cabo Verde (2.6%, a difference of 0.43%), Iroquois (2.6%, a difference of 0.61%), Immigrants from Dominican Republic (2.6%, a difference of 0.64%), and Arapaho (2.6%, a difference of 0.65%).
| Demographics | Rating | Rank | Vision Disability |
| Mexicans | 0.0 /100 | #298 | Tragic 2.5% |
| Cree | 0.0 /100 | #299 | Tragic 2.5% |
| Africans | 0.0 /100 | #300 | Tragic 2.5% |
| Menominee | 0.0 /100 | #301 | Tragic 2.5% |
| Spanish American Indians | 0.0 /100 | #302 | Tragic 2.6% |
| Immigrants | Cabo Verde | 0.0 /100 | #303 | Tragic 2.6% |
| Aleuts | 0.0 /100 | #304 | Tragic 2.6% |
| Hispanics or Latinos | 0.0 /100 | #305 | Tragic 2.6% |
| Iroquois | 0.0 /100 | #306 | Tragic 2.6% |
| Immigrants | Dominican Republic | 0.0 /100 | #307 | Tragic 2.6% |
| Arapaho | 0.0 /100 | #308 | Tragic 2.6% |
| Immigrants | Yemen | 0.0 /100 | #309 | Tragic 2.6% |
| Blackfeet | 0.0 /100 | #310 | Tragic 2.6% |
| Dominicans | 0.0 /100 | #311 | Tragic 2.6% |
| Americans | 0.0 /100 | #312 | Tragic 2.6% |
Demographics Similar to Syrians by Vision Disability
In terms of vision disability, the demographic groups most similar to Syrians are Venezuelan (2.1%, a difference of 0.050%), New Zealander (2.1%, a difference of 0.10%), Vietnamese (2.1%, a difference of 0.12%), Immigrants from Hungary (2.1%, a difference of 0.17%), and Czech (2.1%, a difference of 0.17%).
| Demographics | Rating | Rank | Vision Disability |
| Immigrants | Peru | 89.5 /100 | #126 | Excellent 2.1% |
| Sudanese | 89.2 /100 | #127 | Excellent 2.1% |
| Immigrants | Chile | 89.0 /100 | #128 | Excellent 2.1% |
| Immigrants | Cameroon | 88.8 /100 | #129 | Excellent 2.1% |
| Immigrants | Kenya | 88.7 /100 | #130 | Excellent 2.1% |
| Immigrants | Hungary | 88.7 /100 | #131 | Excellent 2.1% |
| New Zealanders | 88.2 /100 | #132 | Excellent 2.1% |
| Syrians | 87.5 /100 | #133 | Excellent 2.1% |
| Venezuelans | 87.2 /100 | #134 | Excellent 2.1% |
| Vietnamese | 86.7 /100 | #135 | Excellent 2.1% |
| Czechs | 86.3 /100 | #136 | Excellent 2.1% |
| Immigrants | South Eastern Asia | 86.3 /100 | #137 | Excellent 2.1% |
| Arabs | 86.3 /100 | #138 | Excellent 2.1% |
| Immigrants | Morocco | 85.2 /100 | #139 | Excellent 2.1% |
| Immigrants | Netherlands | 84.2 /100 | #140 | Excellent 2.1% |