Chilean vs Immigrants from Serbia Ambulatory Disability
COMPARE
Chilean
Immigrants from Serbia
Ambulatory Disability
Ambulatory Disability Comparison
Chileans
Immigrants from Serbia
5.7%
AMBULATORY DISABILITY
99.2/ 100
METRIC RATING
79th/ 347
METRIC RANK
5.8%
AMBULATORY DISABILITY
97.9/ 100
METRIC RATING
100th/ 347
METRIC RANK
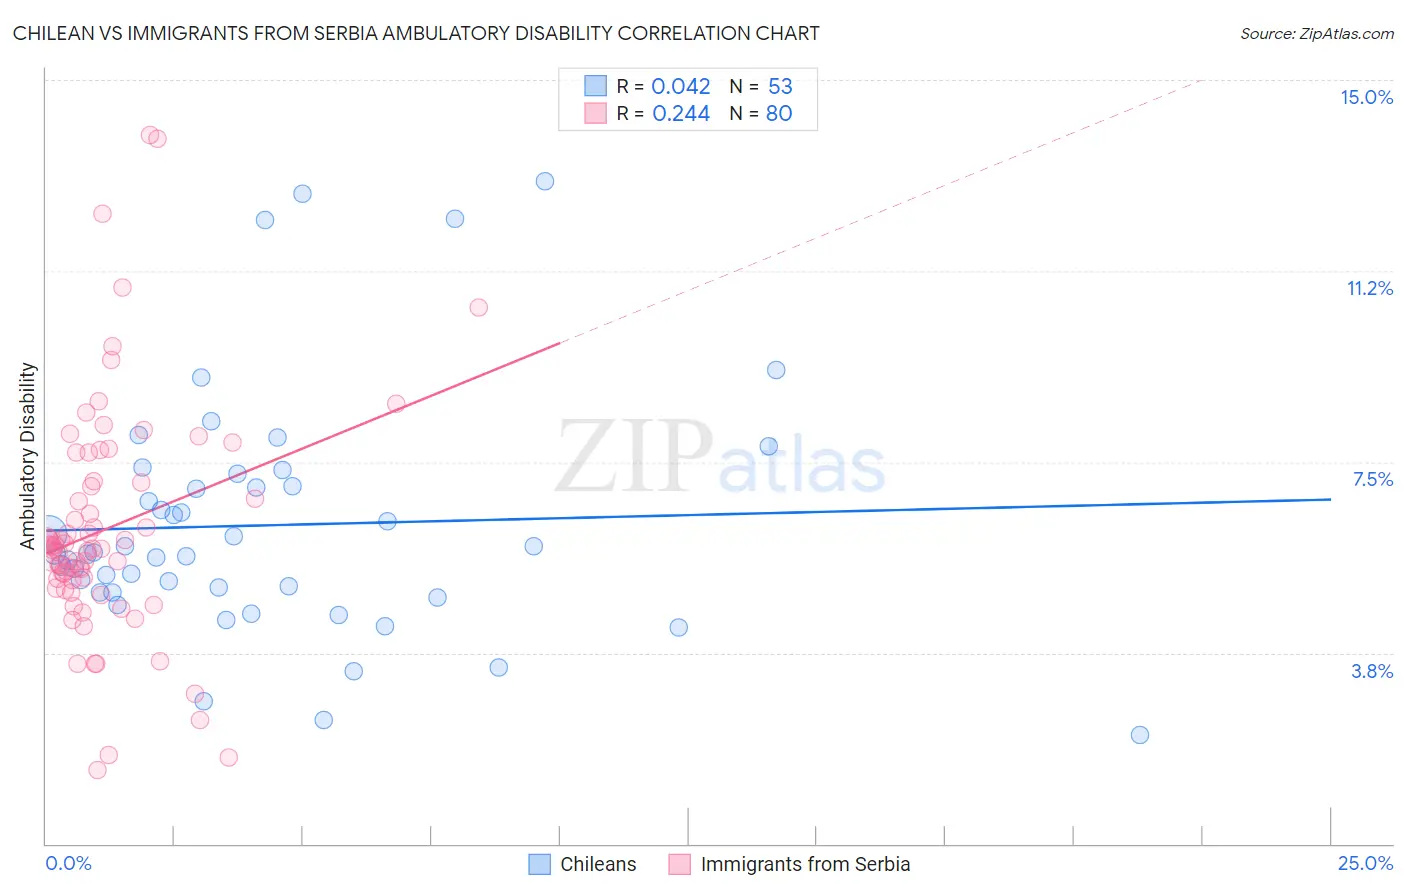
Chilean vs Immigrants from Serbia Ambulatory Disability Correlation Chart
The statistical analysis conducted on geographies consisting of 256,632,151 people shows no correlation between the proportion of Chileans and percentage of population with ambulatory disability in the United States with a correlation coefficient (R) of 0.042 and weighted average of 5.7%. Similarly, the statistical analysis conducted on geographies consisting of 131,742,099 people shows a weak positive correlation between the proportion of Immigrants from Serbia and percentage of population with ambulatory disability in the United States with a correlation coefficient (R) of 0.244 and weighted average of 5.8%, a difference of 1.4%.
Ambulatory Disability Correlation Summary
| Measurement | Chilean | Immigrants from Serbia |
| Minimum | 2.1% | 1.5% |
| Maximum | 13.0% | 13.9% |
| Range | 10.9% | 12.5% |
| Mean | 6.3% | 6.2% |
| Median | 5.7% | 5.8% |
| Interquartile 25% (IQ1) | 4.9% | 5.1% |
| Interquartile 75% (IQ3) | 7.2% | 7.1% |
| Interquartile Range (IQR) | 2.2% | 2.0% |
| Standard Deviation (Sample) | 2.4% | 2.3% |
| Standard Deviation (Population) | 2.3% | 2.3% |
Similar Demographics by Ambulatory Disability
Demographics Similar to Chileans by Ambulatory Disability
In terms of ambulatory disability, the demographic groups most similar to Chileans are Somali (5.7%, a difference of 0.010%), Immigrants from Vietnam (5.7%, a difference of 0.020%), Immigrants from Ireland (5.7%, a difference of 0.13%), Immigrants from Jordan (5.7%, a difference of 0.14%), and Palestinian (5.7%, a difference of 0.14%).
| Demographics | Rating | Rank | Ambulatory Disability |
| Brazilians | 99.4 /100 | #72 | Exceptional 5.7% |
| Immigrants | Northern Africa | 99.4 /100 | #73 | Exceptional 5.7% |
| Immigrants | Cameroon | 99.4 /100 | #74 | Exceptional 5.7% |
| Immigrants | South Africa | 99.3 /100 | #75 | Exceptional 5.7% |
| Sudanese | 99.3 /100 | #76 | Exceptional 5.7% |
| Immigrants | Vietnam | 99.3 /100 | #77 | Exceptional 5.7% |
| Somalis | 99.2 /100 | #78 | Exceptional 5.7% |
| Chileans | 99.2 /100 | #79 | Exceptional 5.7% |
| Immigrants | Ireland | 99.2 /100 | #80 | Exceptional 5.7% |
| Immigrants | Jordan | 99.2 /100 | #81 | Exceptional 5.7% |
| Palestinians | 99.2 /100 | #82 | Exceptional 5.7% |
| Eastern Europeans | 99.2 /100 | #83 | Exceptional 5.7% |
| Ugandans | 99.2 /100 | #84 | Exceptional 5.7% |
| South Americans | 99.0 /100 | #85 | Exceptional 5.7% |
| Latvians | 99.0 /100 | #86 | Exceptional 5.7% |
Demographics Similar to Immigrants from Serbia by Ambulatory Disability
In terms of ambulatory disability, the demographic groups most similar to Immigrants from Serbia are Immigrants from South America (5.8%, a difference of 0.0%), Immigrants from Kenya (5.8%, a difference of 0.080%), Immigrants from Romania (5.8%, a difference of 0.15%), Immigrants from Northern Europe (5.8%, a difference of 0.19%), and New Zealander (5.8%, a difference of 0.21%).
| Demographics | Rating | Rank | Ambulatory Disability |
| Immigrants | Denmark | 98.6 /100 | #93 | Exceptional 5.8% |
| Kenyans | 98.4 /100 | #94 | Exceptional 5.8% |
| Immigrants | El Salvador | 98.4 /100 | #95 | Exceptional 5.8% |
| Salvadorans | 98.4 /100 | #96 | Exceptional 5.8% |
| Immigrants | Somalia | 98.3 /100 | #97 | Exceptional 5.8% |
| Immigrants | Lebanon | 98.3 /100 | #98 | Exceptional 5.8% |
| Immigrants | Northern Europe | 98.2 /100 | #99 | Exceptional 5.8% |
| Immigrants | Serbia | 97.9 /100 | #100 | Exceptional 5.8% |
| Immigrants | South America | 97.9 /100 | #101 | Exceptional 5.8% |
| Immigrants | Kenya | 97.8 /100 | #102 | Exceptional 5.8% |
| Immigrants | Romania | 97.7 /100 | #103 | Exceptional 5.8% |
| New Zealanders | 97.6 /100 | #104 | Exceptional 5.8% |
| Immigrants | Czechoslovakia | 97.4 /100 | #105 | Exceptional 5.8% |
| Immigrants | Morocco | 97.3 /100 | #106 | Exceptional 5.8% |
| Uruguayans | 97.2 /100 | #107 | Exceptional 5.8% |