Bermudan vs Puget Sound Salish Disability Age 18 to 34
COMPARE
Bermudan
Puget Sound Salish
Disability Age 18 to 34
Disability Age 18 to 34 Comparison
Bermudans
Puget Sound Salish
7.3%
DISABILITY AGE 18 TO 34
0.1/ 100
METRIC RATING
264th/ 347
METRIC RANK
8.3%
DISABILITY AGE 18 TO 34
0.0/ 100
METRIC RATING
332nd/ 347
METRIC RANK
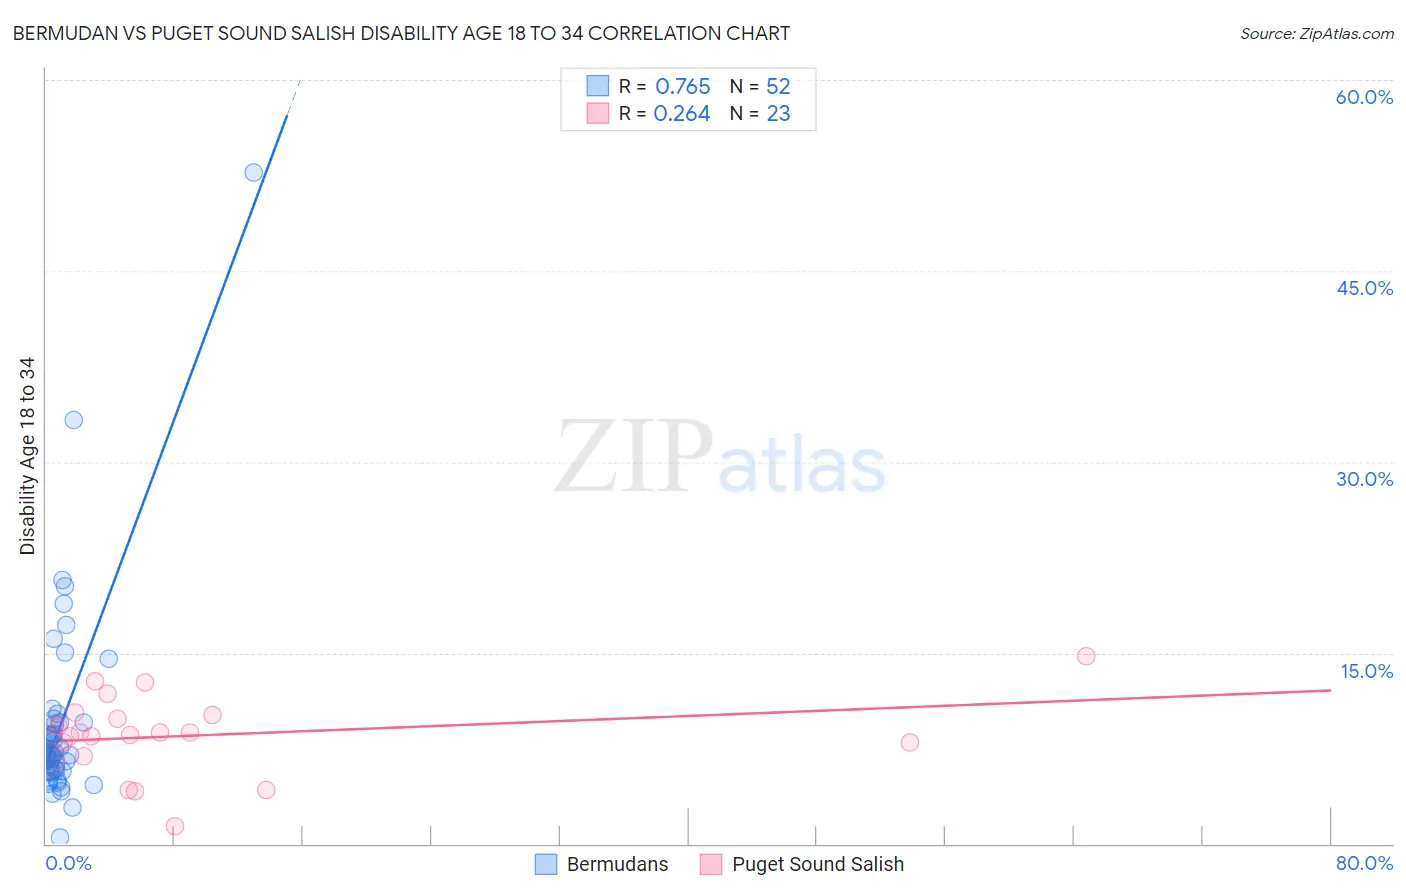
Bermudan vs Puget Sound Salish Disability Age 18 to 34 Correlation Chart
The statistical analysis conducted on geographies consisting of 55,708,808 people shows a strong positive correlation between the proportion of Bermudans and percentage of population with a disability between the ages 18 and 35 in the United States with a correlation coefficient (R) of 0.765 and weighted average of 7.3%. Similarly, the statistical analysis conducted on geographies consisting of 46,117,353 people shows a weak positive correlation between the proportion of Puget Sound Salish and percentage of population with a disability between the ages 18 and 35 in the United States with a correlation coefficient (R) of 0.264 and weighted average of 8.3%, a difference of 13.4%.
Disability Age 18 to 34 Correlation Summary
| Measurement | Bermudan | Puget Sound Salish |
| Minimum | 0.49% | 1.4% |
| Maximum | 52.7% | 14.8% |
| Range | 52.3% | 13.4% |
| Mean | 9.6% | 8.5% |
| Median | 7.1% | 8.7% |
| Interquartile 25% (IQ1) | 5.7% | 6.8% |
| Interquartile 75% (IQ3) | 9.5% | 10.1% |
| Interquartile Range (IQR) | 3.8% | 3.2% |
| Standard Deviation (Sample) | 8.2% | 3.1% |
| Standard Deviation (Population) | 8.1% | 3.0% |
Similar Demographics by Disability Age 18 to 34
Demographics Similar to Bermudans by Disability Age 18 to 34
In terms of disability age 18 to 34, the demographic groups most similar to Bermudans are Slovene (7.3%, a difference of 0.020%), German Russian (7.4%, a difference of 0.19%), British (7.3%, a difference of 0.25%), Bangladeshi (7.4%, a difference of 0.25%), and Portuguese (7.4%, a difference of 0.33%).
| Demographics | Rating | Rank | Disability Age 18 to 34 |
| Czechs | 0.3 /100 | #257 | Tragic 7.2% |
| Immigrants | Micronesia | 0.3 /100 | #258 | Tragic 7.3% |
| Somalis | 0.2 /100 | #259 | Tragic 7.3% |
| Tohono O'odham | 0.2 /100 | #260 | Tragic 7.3% |
| Northern Europeans | 0.2 /100 | #261 | Tragic 7.3% |
| Canadians | 0.2 /100 | #262 | Tragic 7.3% |
| British | 0.2 /100 | #263 | Tragic 7.3% |
| Bermudans | 0.1 /100 | #264 | Tragic 7.3% |
| Slovenes | 0.1 /100 | #265 | Tragic 7.3% |
| German Russians | 0.1 /100 | #266 | Tragic 7.4% |
| Bangladeshis | 0.1 /100 | #267 | Tragic 7.4% |
| Portuguese | 0.1 /100 | #268 | Tragic 7.4% |
| Basques | 0.1 /100 | #269 | Tragic 7.4% |
| Belgians | 0.1 /100 | #270 | Tragic 7.4% |
| Swiss | 0.1 /100 | #271 | Tragic 7.4% |
Demographics Similar to Puget Sound Salish by Disability Age 18 to 34
In terms of disability age 18 to 34, the demographic groups most similar to Puget Sound Salish are Comanche (8.3%, a difference of 0.22%), Osage (8.3%, a difference of 0.40%), Crow (8.3%, a difference of 0.66%), Apache (8.4%, a difference of 1.1%), and Delaware (8.2%, a difference of 1.2%).
| Demographics | Rating | Rank | Disability Age 18 to 34 |
| Natives/Alaskans | 0.0 /100 | #325 | Tragic 8.2% |
| Potawatomi | 0.0 /100 | #326 | Tragic 8.2% |
| Sioux | 0.0 /100 | #327 | Tragic 8.2% |
| Delaware | 0.0 /100 | #328 | Tragic 8.2% |
| Crow | 0.0 /100 | #329 | Tragic 8.3% |
| Osage | 0.0 /100 | #330 | Tragic 8.3% |
| Comanche | 0.0 /100 | #331 | Tragic 8.3% |
| Puget Sound Salish | 0.0 /100 | #332 | Tragic 8.3% |
| Apache | 0.0 /100 | #333 | Tragic 8.4% |
| Dutch West Indians | 0.0 /100 | #334 | Tragic 8.4% |
| Seminole | 0.0 /100 | #335 | Tragic 8.4% |
| Immigrants | Azores | 0.0 /100 | #336 | Tragic 8.5% |
| Ottawa | 0.0 /100 | #337 | Tragic 8.6% |
| Cherokee | 0.0 /100 | #338 | Tragic 8.7% |
| Kiowa | 0.0 /100 | #339 | Tragic 8.8% |