Australian vs Immigrants from Indonesia Disability
COMPARE
Australian
Immigrants from Indonesia
Disability
Disability Comparison
Australians
Immigrants from Indonesia
11.5%
DISABILITY
82.5/ 100
METRIC RATING
144th/ 347
METRIC RANK
10.7%
DISABILITY
100.0/ 100
METRIC RATING
35th/ 347
METRIC RANK
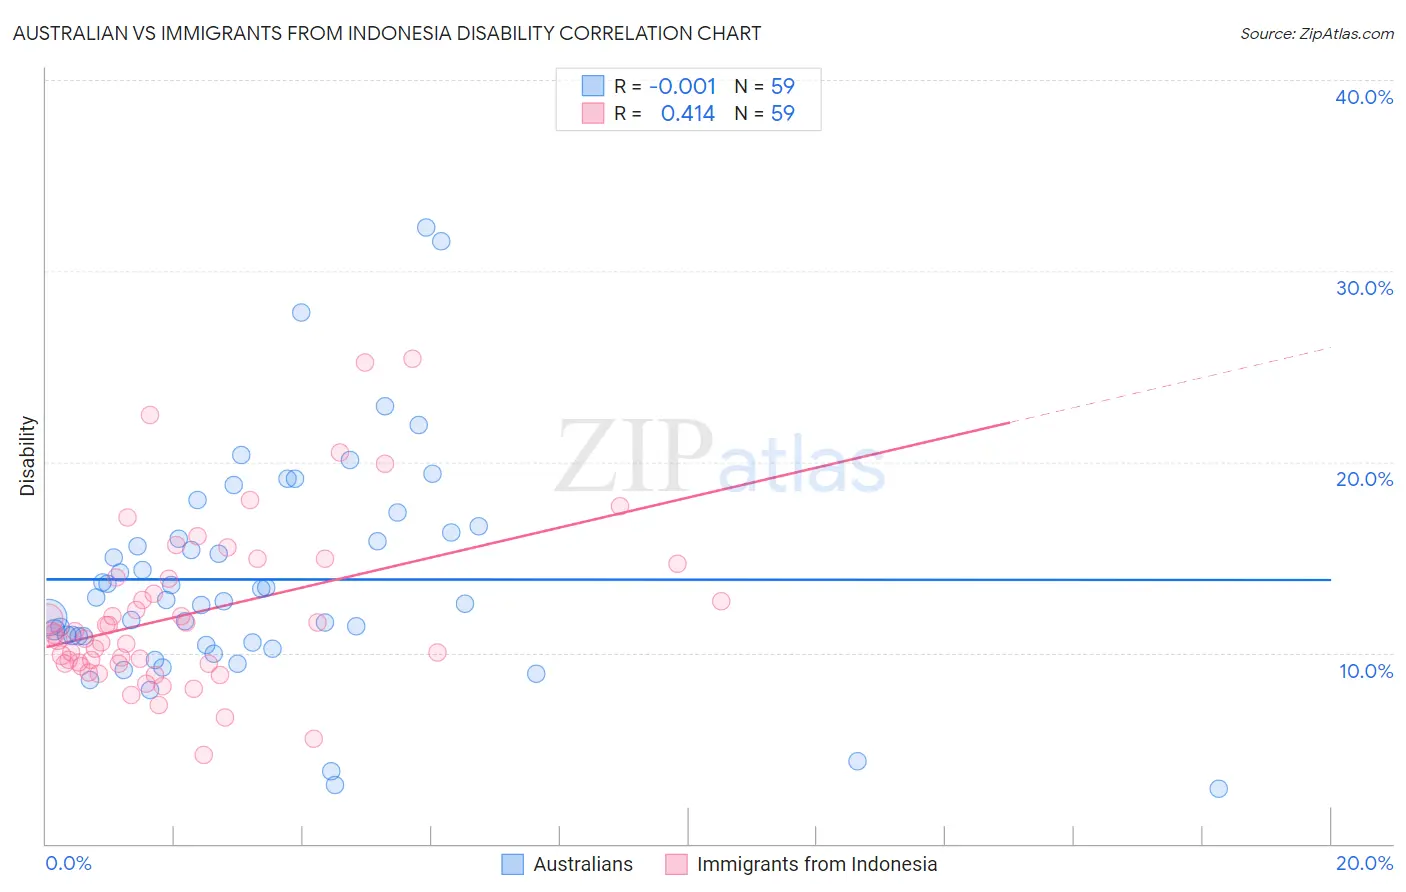
Australian vs Immigrants from Indonesia Disability Correlation Chart
The statistical analysis conducted on geographies consisting of 224,142,596 people shows no correlation between the proportion of Australians and percentage of population with a disability in the United States with a correlation coefficient (R) of -0.001 and weighted average of 11.5%. Similarly, the statistical analysis conducted on geographies consisting of 215,790,379 people shows a moderate positive correlation between the proportion of Immigrants from Indonesia and percentage of population with a disability in the United States with a correlation coefficient (R) of 0.414 and weighted average of 10.7%, a difference of 7.5%.
Disability Correlation Summary
| Measurement | Australian | Immigrants from Indonesia |
| Minimum | 2.9% | 4.7% |
| Maximum | 32.3% | 25.4% |
| Range | 29.3% | 20.7% |
| Mean | 13.8% | 12.1% |
| Median | 12.8% | 11.0% |
| Interquartile 25% (IQ1) | 10.6% | 9.4% |
| Interquartile 75% (IQ3) | 16.3% | 14.0% |
| Interquartile Range (IQR) | 5.7% | 4.5% |
| Standard Deviation (Sample) | 5.8% | 4.3% |
| Standard Deviation (Population) | 5.8% | 4.3% |
Similar Demographics by Disability
Demographics Similar to Australians by Disability
In terms of disability, the demographic groups most similar to Australians are Moroccan (11.5%, a difference of 0.070%), Nigerian (11.5%, a difference of 0.090%), Immigrants from Sudan (11.5%, a difference of 0.24%), Immigrants from Hungary (11.5%, a difference of 0.25%), and Immigrants from Grenada (11.5%, a difference of 0.31%).
| Demographics | Rating | Rank | Disability |
| Kenyans | 87.1 /100 | #137 | Excellent 11.5% |
| New Zealanders | 87.0 /100 | #138 | Excellent 11.5% |
| Ghanaians | 87.0 /100 | #139 | Excellent 11.5% |
| Russians | 86.8 /100 | #140 | Excellent 11.5% |
| Immigrants | Grenada | 86.1 /100 | #141 | Excellent 11.5% |
| Immigrants | Sudan | 85.3 /100 | #142 | Excellent 11.5% |
| Moroccans | 83.3 /100 | #143 | Excellent 11.5% |
| Australians | 82.5 /100 | #144 | Excellent 11.5% |
| Nigerians | 81.3 /100 | #145 | Excellent 11.5% |
| Immigrants | Hungary | 79.0 /100 | #146 | Good 11.5% |
| Immigrants | Ukraine | 77.6 /100 | #147 | Good 11.5% |
| Sudanese | 77.1 /100 | #148 | Good 11.5% |
| Immigrants | Norway | 73.2 /100 | #149 | Good 11.6% |
| Romanians | 72.7 /100 | #150 | Good 11.6% |
| Immigrants | Kenya | 72.1 /100 | #151 | Good 11.6% |
Demographics Similar to Immigrants from Indonesia by Disability
In terms of disability, the demographic groups most similar to Immigrants from Indonesia are Immigrants from Ethiopia (10.7%, a difference of 0.010%), Ethiopian (10.7%, a difference of 0.060%), Turkish (10.7%, a difference of 0.070%), Immigrants from Kuwait (10.7%, a difference of 0.23%), and Paraguayan (10.6%, a difference of 0.48%).
| Demographics | Rating | Rank | Disability |
| Egyptians | 100.0 /100 | #28 | Exceptional 10.6% |
| Immigrants | Argentina | 100.0 /100 | #29 | Exceptional 10.6% |
| Immigrants | Turkey | 100.0 /100 | #30 | Exceptional 10.6% |
| Immigrants | Egypt | 100.0 /100 | #31 | Exceptional 10.6% |
| Paraguayans | 100.0 /100 | #32 | Exceptional 10.6% |
| Immigrants | Kuwait | 100.0 /100 | #33 | Exceptional 10.7% |
| Immigrants | Ethiopia | 100.0 /100 | #34 | Exceptional 10.7% |
| Immigrants | Indonesia | 100.0 /100 | #35 | Exceptional 10.7% |
| Ethiopians | 100.0 /100 | #36 | Exceptional 10.7% |
| Turks | 100.0 /100 | #37 | Exceptional 10.7% |
| Afghans | 99.9 /100 | #38 | Exceptional 10.8% |
| Cambodians | 99.9 /100 | #39 | Exceptional 10.8% |
| Mongolians | 99.9 /100 | #40 | Exceptional 10.8% |
| Immigrants | Australia | 99.9 /100 | #41 | Exceptional 10.8% |
| Immigrants | Nepal | 99.9 /100 | #42 | Exceptional 10.8% |