Immigrants from Northern Europe vs Immigrants from Indonesia Disability
COMPARE
Immigrants from Northern Europe
Immigrants from Indonesia
Disability
Disability Comparison
Immigrants from Northern Europe
Immigrants from Indonesia
11.3%
DISABILITY
94.1/ 100
METRIC RATING
116th/ 347
METRIC RANK
10.7%
DISABILITY
100.0/ 100
METRIC RATING
35th/ 347
METRIC RANK
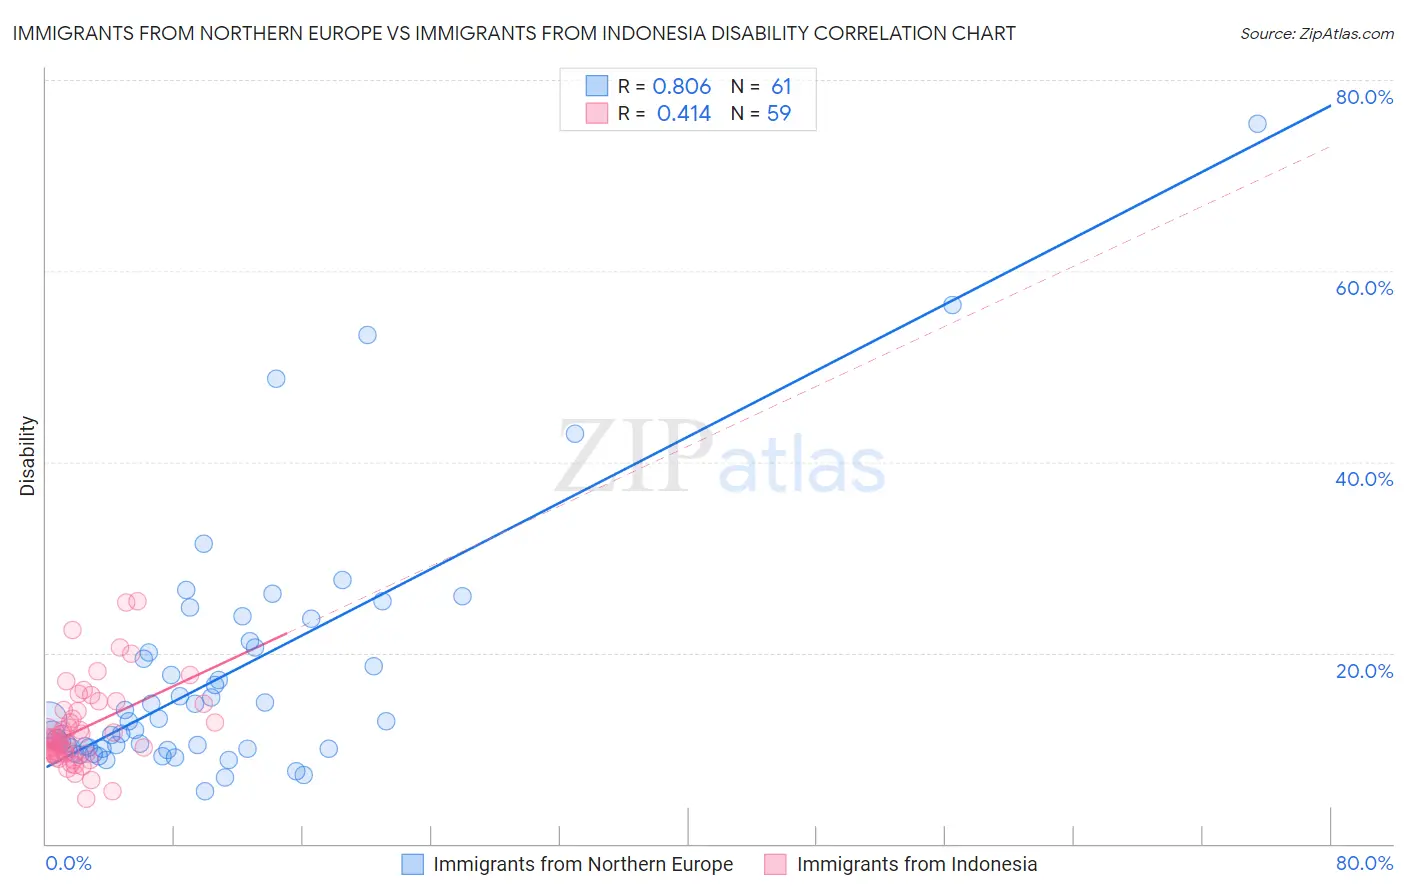
Immigrants from Northern Europe vs Immigrants from Indonesia Disability Correlation Chart
The statistical analysis conducted on geographies consisting of 477,212,072 people shows a very strong positive correlation between the proportion of Immigrants from Northern Europe and percentage of population with a disability in the United States with a correlation coefficient (R) of 0.806 and weighted average of 11.3%. Similarly, the statistical analysis conducted on geographies consisting of 215,790,379 people shows a moderate positive correlation between the proportion of Immigrants from Indonesia and percentage of population with a disability in the United States with a correlation coefficient (R) of 0.414 and weighted average of 10.7%, a difference of 6.0%.
Disability Correlation Summary
| Measurement | Immigrants from Northern Europe | Immigrants from Indonesia |
| Minimum | 5.5% | 4.7% |
| Maximum | 75.4% | 25.4% |
| Range | 69.9% | 20.7% |
| Mean | 17.8% | 12.1% |
| Median | 12.9% | 11.0% |
| Interquartile 25% (IQ1) | 10.0% | 9.4% |
| Interquartile 75% (IQ3) | 20.9% | 14.0% |
| Interquartile Range (IQR) | 10.9% | 4.5% |
| Standard Deviation (Sample) | 13.2% | 4.3% |
| Standard Deviation (Population) | 13.1% | 4.3% |
Similar Demographics by Disability
Demographics Similar to Immigrants from Northern Europe by Disability
In terms of disability, the demographic groups most similar to Immigrants from Northern Europe are Luxembourger (11.3%, a difference of 0.060%), Korean (11.3%, a difference of 0.070%), Immigrants from Philippines (11.3%, a difference of 0.11%), Central American (11.4%, a difference of 0.12%), and Immigrants from North Macedonia (11.4%, a difference of 0.12%).
| Demographics | Rating | Rank | Disability |
| Immigrants | Uganda | 95.7 /100 | #109 | Exceptional 11.3% |
| Immigrants | Denmark | 95.6 /100 | #110 | Exceptional 11.3% |
| Immigrants | South Eastern Asia | 95.4 /100 | #111 | Exceptional 11.3% |
| Immigrants | Uzbekistan | 94.9 /100 | #112 | Exceptional 11.3% |
| Guyanese | 94.7 /100 | #113 | Exceptional 11.3% |
| Immigrants | Syria | 94.7 /100 | #114 | Exceptional 11.3% |
| Immigrants | Philippines | 94.6 /100 | #115 | Exceptional 11.3% |
| Immigrants | Northern Europe | 94.1 /100 | #116 | Exceptional 11.3% |
| Luxembourgers | 93.9 /100 | #117 | Exceptional 11.3% |
| Koreans | 93.8 /100 | #118 | Exceptional 11.3% |
| Central Americans | 93.5 /100 | #119 | Exceptional 11.4% |
| Immigrants | North Macedonia | 93.5 /100 | #120 | Exceptional 11.4% |
| Immigrants | Costa Rica | 93.4 /100 | #121 | Exceptional 11.4% |
| Brazilians | 93.3 /100 | #122 | Exceptional 11.4% |
| South Africans | 92.3 /100 | #123 | Exceptional 11.4% |
Demographics Similar to Immigrants from Indonesia by Disability
In terms of disability, the demographic groups most similar to Immigrants from Indonesia are Immigrants from Ethiopia (10.7%, a difference of 0.010%), Ethiopian (10.7%, a difference of 0.060%), Turkish (10.7%, a difference of 0.070%), Immigrants from Kuwait (10.7%, a difference of 0.23%), and Paraguayan (10.6%, a difference of 0.48%).
| Demographics | Rating | Rank | Disability |
| Egyptians | 100.0 /100 | #28 | Exceptional 10.6% |
| Immigrants | Argentina | 100.0 /100 | #29 | Exceptional 10.6% |
| Immigrants | Turkey | 100.0 /100 | #30 | Exceptional 10.6% |
| Immigrants | Egypt | 100.0 /100 | #31 | Exceptional 10.6% |
| Paraguayans | 100.0 /100 | #32 | Exceptional 10.6% |
| Immigrants | Kuwait | 100.0 /100 | #33 | Exceptional 10.7% |
| Immigrants | Ethiopia | 100.0 /100 | #34 | Exceptional 10.7% |
| Immigrants | Indonesia | 100.0 /100 | #35 | Exceptional 10.7% |
| Ethiopians | 100.0 /100 | #36 | Exceptional 10.7% |
| Turks | 100.0 /100 | #37 | Exceptional 10.7% |
| Afghans | 99.9 /100 | #38 | Exceptional 10.8% |
| Cambodians | 99.9 /100 | #39 | Exceptional 10.8% |
| Mongolians | 99.9 /100 | #40 | Exceptional 10.8% |
| Immigrants | Australia | 99.9 /100 | #41 | Exceptional 10.8% |
| Immigrants | Nepal | 99.9 /100 | #42 | Exceptional 10.8% |