African vs Immigrants from Italy Female Disability
COMPARE
African
Immigrants from Italy
Female Disability
Female Disability Comparison
Africans
Immigrants from Italy
13.4%
FEMALE DISABILITY
0.0/ 100
METRIC RATING
301st/ 347
METRIC RANK
11.8%
FEMALE DISABILITY
96.4/ 100
METRIC RATING
125th/ 347
METRIC RANK
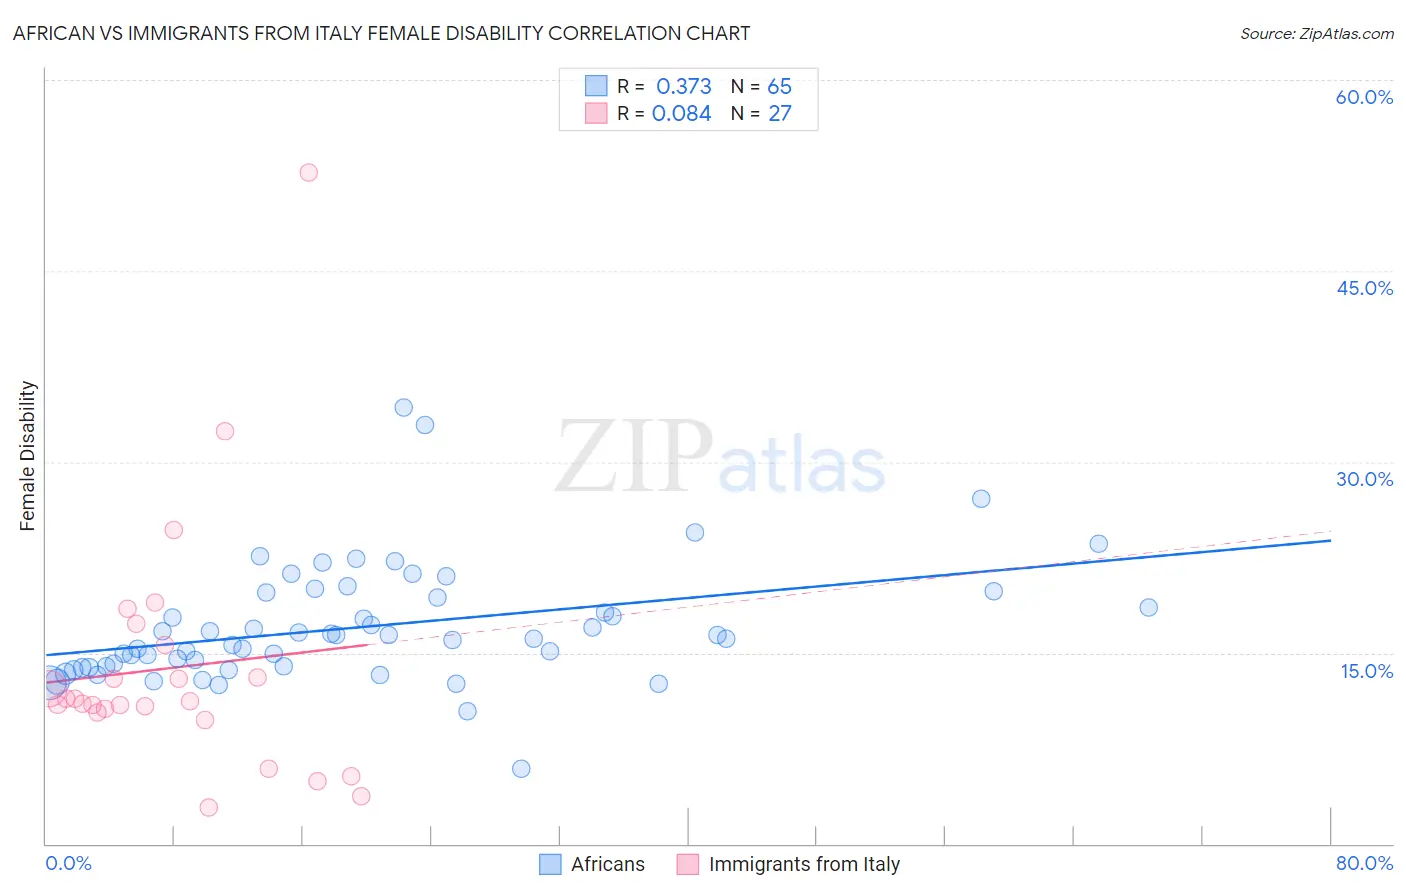
African vs Immigrants from Italy Female Disability Correlation Chart
The statistical analysis conducted on geographies consisting of 469,943,278 people shows a mild positive correlation between the proportion of Africans and percentage of females with a disability in the United States with a correlation coefficient (R) of 0.373 and weighted average of 13.4%. Similarly, the statistical analysis conducted on geographies consisting of 324,199,365 people shows a slight positive correlation between the proportion of Immigrants from Italy and percentage of females with a disability in the United States with a correlation coefficient (R) of 0.084 and weighted average of 11.8%, a difference of 13.7%.
Female Disability Correlation Summary
| Measurement | African | Immigrants from Italy |
| Minimum | 5.9% | 2.9% |
| Maximum | 34.2% | 52.8% |
| Range | 28.4% | 49.9% |
| Mean | 17.0% | 13.8% |
| Median | 16.1% | 11.2% |
| Interquartile 25% (IQ1) | 13.9% | 10.3% |
| Interquartile 75% (IQ3) | 19.5% | 15.6% |
| Interquartile Range (IQR) | 5.6% | 5.3% |
| Standard Deviation (Sample) | 4.7% | 10.0% |
| Standard Deviation (Population) | 4.7% | 9.8% |
Similar Demographics by Female Disability
Demographics Similar to Africans by Female Disability
In terms of female disability, the demographic groups most similar to Africans are Scotch-Irish (13.4%, a difference of 0.14%), Immigrants from Portugal (13.5%, a difference of 0.14%), Immigrants from Micronesia (13.5%, a difference of 0.17%), Pennsylvania German (13.4%, a difference of 0.20%), and Immigrants from Dominican Republic (13.4%, a difference of 0.21%).
| Demographics | Rating | Rank | Female Disability |
| Celtics | 0.0 /100 | #294 | Tragic 13.3% |
| French | 0.0 /100 | #295 | Tragic 13.3% |
| Nepalese | 0.0 /100 | #296 | Tragic 13.3% |
| Slovaks | 0.0 /100 | #297 | Tragic 13.3% |
| Immigrants | Nonimmigrants | 0.0 /100 | #298 | Tragic 13.4% |
| Immigrants | Dominican Republic | 0.0 /100 | #299 | Tragic 13.4% |
| Pennsylvania Germans | 0.0 /100 | #300 | Tragic 13.4% |
| Africans | 0.0 /100 | #301 | Tragic 13.4% |
| Scotch-Irish | 0.0 /100 | #302 | Tragic 13.4% |
| Immigrants | Portugal | 0.0 /100 | #303 | Tragic 13.5% |
| Immigrants | Micronesia | 0.0 /100 | #304 | Tragic 13.5% |
| Dominicans | 0.0 /100 | #305 | Tragic 13.5% |
| French Canadians | 0.0 /100 | #306 | Tragic 13.6% |
| Central American Indians | 0.0 /100 | #307 | Tragic 13.6% |
| Cree | 0.0 /100 | #308 | Tragic 13.7% |
Demographics Similar to Immigrants from Italy by Female Disability
In terms of female disability, the demographic groups most similar to Immigrants from Italy are Russian (11.8%, a difference of 0.030%), Immigrants from Europe (11.8%, a difference of 0.060%), Immigrants from Croatia (11.8%, a difference of 0.070%), Immigrants from North Macedonia (11.8%, a difference of 0.13%), and Immigrants from Netherlands (11.8%, a difference of 0.14%).
| Demographics | Rating | Rank | Female Disability |
| Immigrants | Nigeria | 97.2 /100 | #118 | Exceptional 11.8% |
| Immigrants | Uganda | 97.2 /100 | #119 | Exceptional 11.8% |
| Immigrants | Kazakhstan | 97.0 /100 | #120 | Exceptional 11.8% |
| Immigrants | Netherlands | 96.9 /100 | #121 | Exceptional 11.8% |
| Immigrants | North Macedonia | 96.8 /100 | #122 | Exceptional 11.8% |
| Immigrants | Croatia | 96.7 /100 | #123 | Exceptional 11.8% |
| Russians | 96.5 /100 | #124 | Exceptional 11.8% |
| Immigrants | Italy | 96.4 /100 | #125 | Exceptional 11.8% |
| Immigrants | Europe | 96.2 /100 | #126 | Exceptional 11.8% |
| South American Indians | 95.8 /100 | #127 | Exceptional 11.8% |
| Immigrants | Latvia | 95.6 /100 | #128 | Exceptional 11.8% |
| Macedonians | 95.5 /100 | #129 | Exceptional 11.8% |
| Nicaraguans | 95.2 /100 | #130 | Exceptional 11.9% |
| Arabs | 95.1 /100 | #131 | Exceptional 11.9% |
| Immigrants | Syria | 94.6 /100 | #132 | Exceptional 11.9% |