Zip Codes with the Highest Percentage of Population Employed in Personal Care and Service in Newark, DE

RELATED REPORTS & OPTIONS

Personal Care and Service
Population
Families and Households
Female Fertility
Female Fertility (Unmarried)
Race (Community Size)
Race (Percentage)
Ancestry (Community Size)
AfghanAfricanAlbanianAmericanArabArgentineanArmenianAustralianAustrianBelgianBhutaneseBlackfeetBrazilianBritishBritish West IndianBulgarianBurmeseCanadianCentral AmericanCentral American IndianCherokeeChoctawColombianCosta RicanCroatianCubanCzechCzechoslovakianDanishDelawareDominicanDutchEastern EuropeanEcuadorianEgyptianEnglishEstonianEthiopianEuropeanFilipinoFinnishFrenchFrench CanadianGermanGhanaianGreekGuatemalanGuyaneseHaitianHonduranHungarianIndian (Asian)IranianIrishItalianJamaicanKenyanKoreanLaotianLebaneseLithuanianMalaysianMalteseMexicanMoroccanNicaraguanNigerianNorthern EuropeanNorwegianPakistaniPalestinianPanamanianPennsylvania GermanPeruvianPolishPortuguesePuerto RicanRomanianRussianSalvadoranScandinavianScotch-IrishScottishSerbianSlavicSlovakSloveneSouth AmericanSpaniardSpanishSri LankanSubsaharan AfricanSwedishSwissSyrianThaiTrinidadian and TobagonianTurkishUkrainianVietnameseWelshWest IndianYugoslavian
Ancestry (Percentage)
AfghanAfricanAlbanianAmericanArabArgentineanArmenianAustralianAustrianBelgianBhutaneseBlackfeetBrazilianBritishBritish West IndianBulgarianBurmeseCanadianCentral AmericanCentral American IndianCherokeeChoctawColombianCosta RicanCroatianCubanCzechCzechoslovakianDanishDelawareDominicanDutchEastern EuropeanEcuadorianEgyptianEnglishEstonianEthiopianEuropeanFilipinoFinnishFrenchFrench CanadianGermanGhanaianGreekGuatemalanGuyaneseHaitianHonduranHungarianIndian (Asian)IranianIrishItalianJamaicanKenyanKoreanLaotianLebaneseLithuanianMalaysianMalteseMexicanMoroccanNicaraguanNigerianNorthern EuropeanNorwegianPakistaniPalestinianPanamanianPennsylvania GermanPeruvianPolishPortuguesePuerto RicanRomanianRussianSalvadoranScandinavianScotch-IrishScottishSerbianSlavicSlovakSloveneSouth AmericanSpaniardSpanishSri LankanSubsaharan AfricanSwedishSwissSyrianThaiTrinidadian and TobagonianTurkishUkrainianVietnameseWelshWest IndianYugoslavian
Immigrant Origin (Total)
Immigrant Origin (Percentage)
Income
Income (Families)
Income (Households)
Poverty
Poverty (Families)
Unemployment
Employment Occupations
Employment Industries
Employer Class
Commute Time
Commute Means
School Enrollment
Education by Degree Field
Occupancy
Finances
Physical Characteristics
Newark
Compare Zip Codes
Comparison Subject

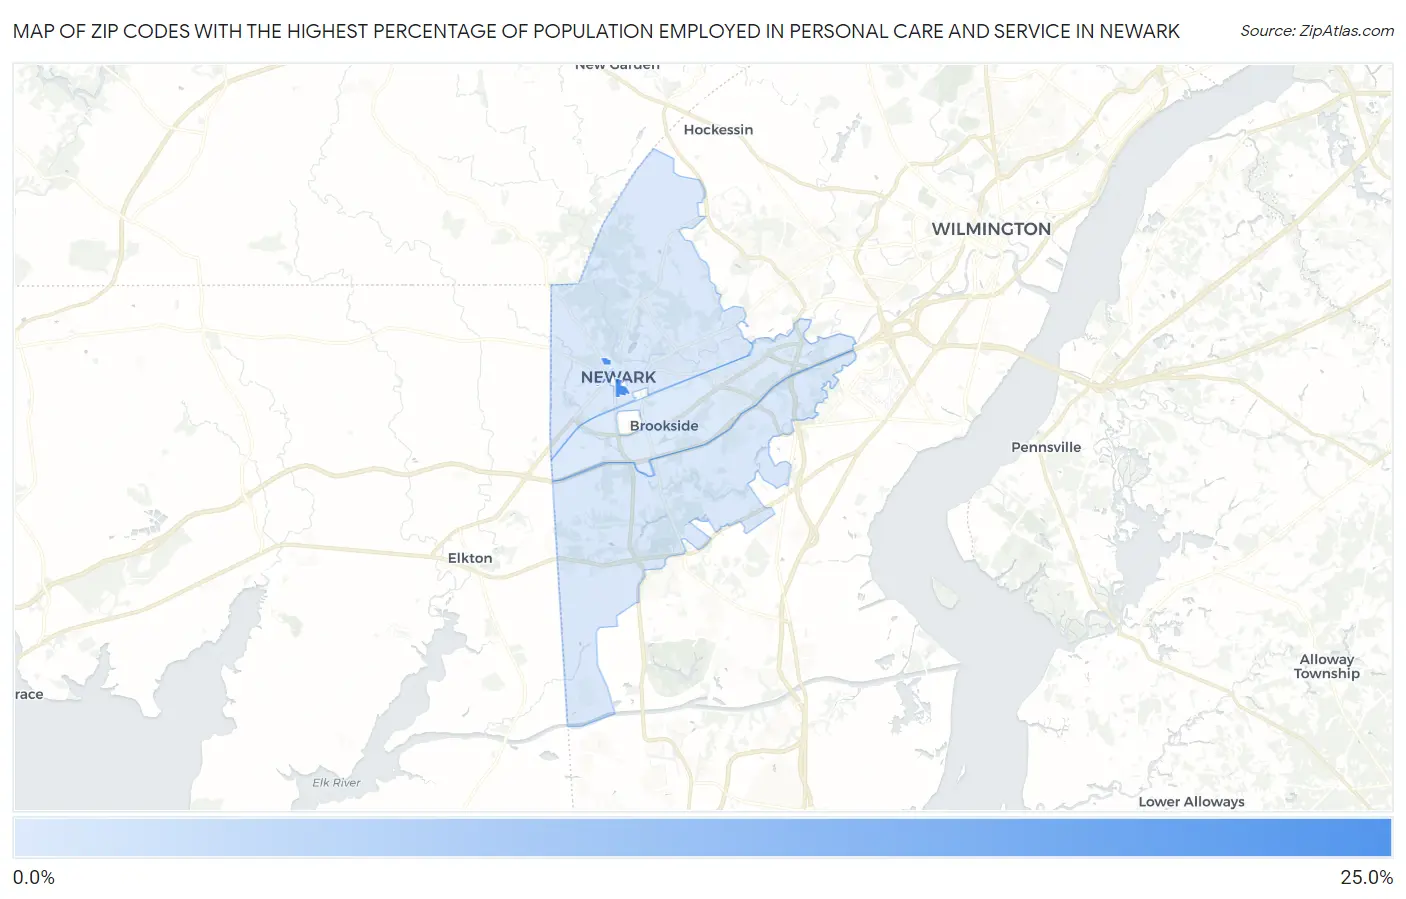
Map of Zip Codes with the Highest Percentage of Population Employed in Personal Care and Service in Newark

0.0%
25.0%
Zip Codes with the Highest Percentage of Population Employed in Personal Care and Service in Newark Map

Zip Codes with the Highest Percentage of Population Employed in Personal Care and Service in Newark, DE

Zip Code % Employed vs State vs National
1.1971721.0%2.6%(+18.4)#12.6%(+18.5)#167
2.197022.6%2.6%(+0.010)#262.6%(+0.084)#10,428
3.197112.3%2.6%(-0.308)#342.6%(-0.234)#12,659
4.197132.1%2.6%(-0.489)#362.6%(-0.415)#14,031

Common Questions

What are the Top 3 Zip Codes with the Highest Percentage of Population Employed in Personal Care and Service in Newark, DE?
Top 3 Zip Codes with the Highest Percentage of Population Employed in Personal Care and Service in Newark, DE are:
#1
21.0%
#2
2.6%
#3
2.3%
What zip code has the Highest Percentage of Population Employed in Personal Care and Service in Newark, DE?
19717 has the Highest Percentage of Population Employed in Personal Care and Service in Newark, DE with 21.0%.
What is the Percentage of Population Employed in Personal Care and Service in Newark, DE?
Percentage of Population Employed in Personal Care and Service in Newark is 6.6%.
What is the Percentage of Population Employed in Personal Care and Service in Delaware?
Percentage of Population Employed in Personal Care and Service in Delaware is 2.6%.
What is the Percentage of Population Employed in Personal Care and Service in the United States?
Percentage of Population Employed in Personal Care and Service in the United States is 2.6%.