Zip Codes with the Highest Percentage of Population Employed in Farming, Fishing & Forestry in Newark, DE
RELATED REPORTS & OPTIONS
Farming, Fishing & Forestry
Newark
Compare Zip Codes
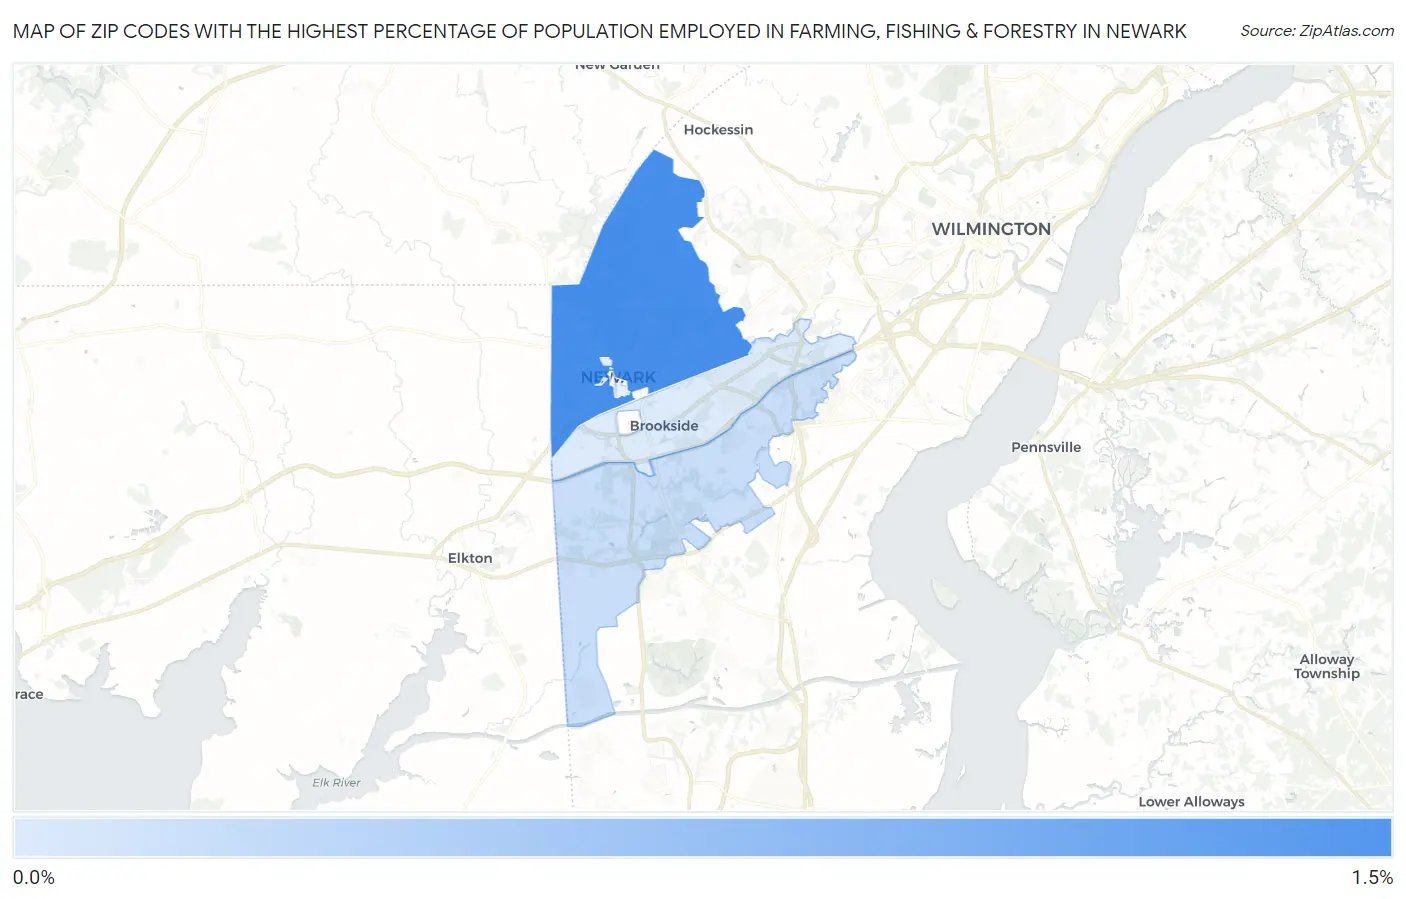
Map of Zip Codes with the Highest Percentage of Population Employed in Farming, Fishing & Forestry in Newark
0.0%
1.5%
Zip Codes with the Highest Percentage of Population Employed in Farming, Fishing & Forestry in Newark, DE
| Zip Code | % Employed | vs State | vs National | |
| 1. | 19711 | 1.1% | 0.46%(+0.590)#12 | 0.61%(+0.449)#9,501 |
| 2. | 19702 | 0.35% | 0.46%(-0.119)#26 | 0.61%(-0.260)#14,309 |
| 3. | 19713 | 0.23% | 0.46%(-0.232)#32 | 0.61%(-0.373)#15,661 |
1
Common Questions
What are the Top 3 Zip Codes with the Highest Percentage of Population Employed in Farming, Fishing & Forestry in Newark, DE?
Top 3 Zip Codes with the Highest Percentage of Population Employed in Farming, Fishing & Forestry in Newark, DE are:
What zip code has the Highest Percentage of Population Employed in Farming, Fishing & Forestry in Newark, DE?
19711 has the Highest Percentage of Population Employed in Farming, Fishing & Forestry in Newark, DE with 1.1%.
What is the Percentage of Population Employed in Farming, Fishing & Forestry in Newark, DE?
Percentage of Population Employed in Farming, Fishing & Forestry in Newark is 0.098%.
What is the Percentage of Population Employed in Farming, Fishing & Forestry in Delaware?
Percentage of Population Employed in Farming, Fishing & Forestry in Delaware is 0.46%.
What is the Percentage of Population Employed in Farming, Fishing & Forestry in the United States?
Percentage of Population Employed in Farming, Fishing & Forestry in the United States is 0.61%.