Zip Codes with the Highest Percentage of Population with a Degree in Liberal Arts and History in Danbury, CT
RELATED REPORTS & OPTIONS
Liberal Arts and History
Danbury
Compare Zip Codes
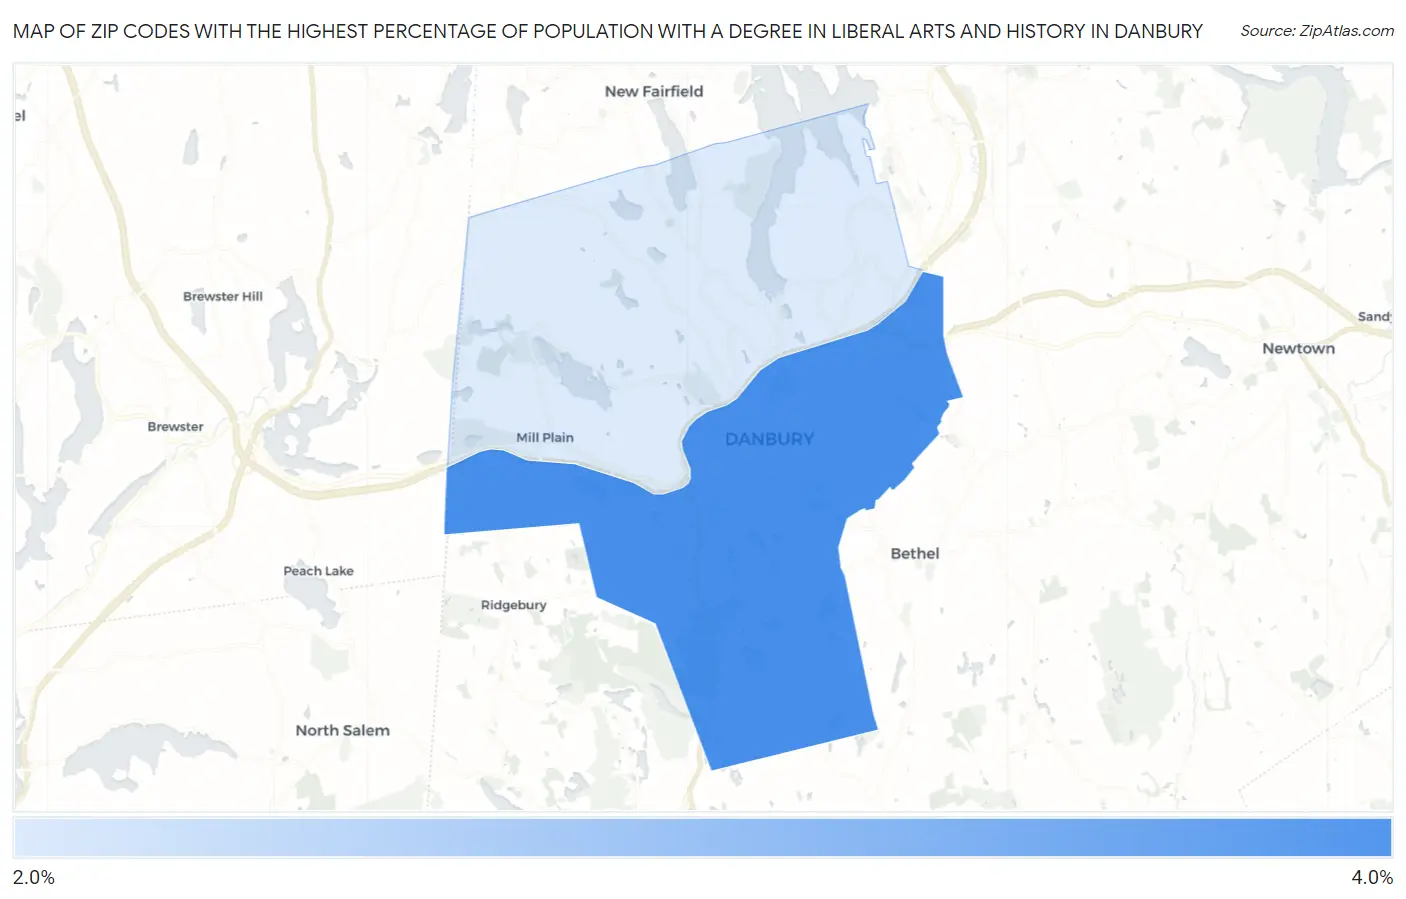
Map of Zip Codes with the Highest Percentage of Population with a Degree in Liberal Arts and History in Danbury
3.0%
3.3%
Zip Codes with the Highest Percentage of Population with a Degree in Liberal Arts and History in Danbury, CT
| Zip Code | % Graduates | vs State | vs National | |
| 1. | 06810 | 3.3% | 5.5%(-2.19)#207 | 4.9%(-1.58)#17,339 |
| 2. | 06811 | 3.0% | 5.5%(-2.52)#217 | 4.9%(-1.90)#18,459 |
1
Common Questions
What are the Top Zip Codes with the Highest Percentage of Population with a Degree in Liberal Arts and History in Danbury, CT?
Top Zip Codes with the Highest Percentage of Population with a Degree in Liberal Arts and History in Danbury, CT are:
What zip code has the Highest Percentage of Population with a Degree in Liberal Arts and History in Danbury, CT?
06810 has the Highest Percentage of Population with a Degree in Liberal Arts and History in Danbury, CT with 3.3%.
What is the Percentage of Population with a Degree in Liberal Arts and History in Danbury, CT?
Percentage of Population with a Degree in Liberal Arts and History in Danbury is 3.1%.
What is the Percentage of Population with a Degree in Liberal Arts and History in Connecticut?
Percentage of Population with a Degree in Liberal Arts and History in Connecticut is 5.5%.
What is the Percentage of Population with a Degree in Liberal Arts and History in the United States?
Percentage of Population with a Degree in Liberal Arts and History in the United States is 4.9%.