Zip Codes with the Highest Percentage of Population with a Degree in Liberal Arts and History in Manchester, CT
RELATED REPORTS & OPTIONS
Liberal Arts and History
Manchester
Compare Zip Codes
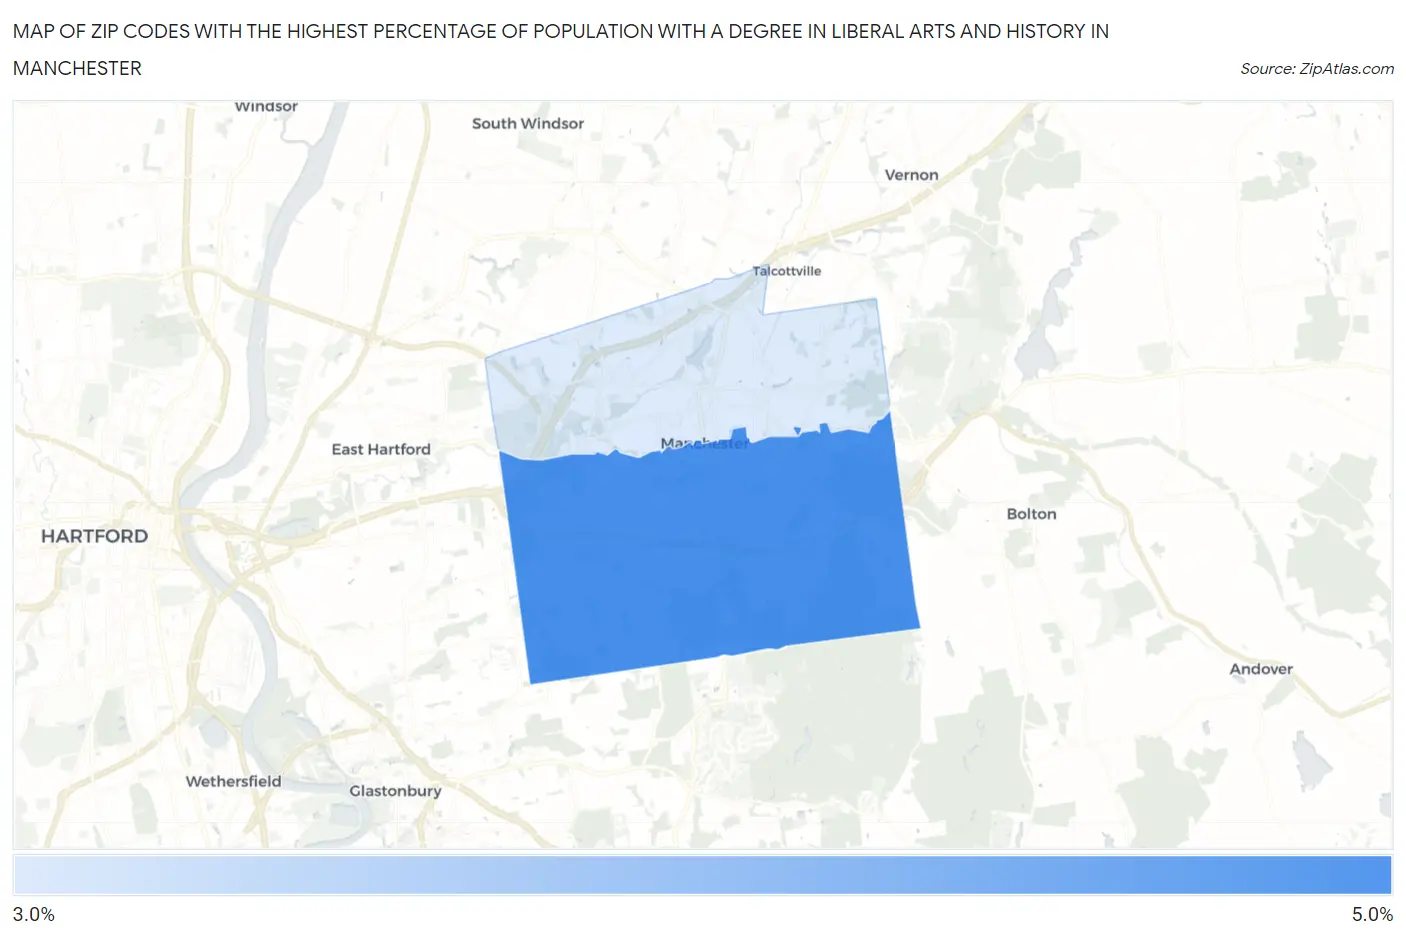
Map of Zip Codes with the Highest Percentage of Population with a Degree in Liberal Arts and History in Manchester
3.2%
4.7%
Zip Codes with the Highest Percentage of Population with a Degree in Liberal Arts and History in Manchester, CT
| Zip Code | % Graduates | vs State | vs National | |
| 1. | 06040 | 4.7% | 5.5%(-0.826)#156 | 4.9%(-0.211)#12,452 |
| 2. | 06042 | 3.2% | 5.5%(-2.31)#212 | 4.9%(-1.69)#17,726 |
1
Common Questions
What are the Top Zip Codes with the Highest Percentage of Population with a Degree in Liberal Arts and History in Manchester, CT?
Top Zip Codes with the Highest Percentage of Population with a Degree in Liberal Arts and History in Manchester, CT are:
What zip code has the Highest Percentage of Population with a Degree in Liberal Arts and History in Manchester, CT?
06040 has the Highest Percentage of Population with a Degree in Liberal Arts and History in Manchester, CT with 4.7%.
What is the Percentage of Population with a Degree in Liberal Arts and History in Manchester, CT?
Percentage of Population with a Degree in Liberal Arts and History in Manchester is 3.6%.
What is the Percentage of Population with a Degree in Liberal Arts and History in Connecticut?
Percentage of Population with a Degree in Liberal Arts and History in Connecticut is 5.5%.
What is the Percentage of Population with a Degree in Liberal Arts and History in the United States?
Percentage of Population with a Degree in Liberal Arts and History in the United States is 4.9%.