Zip Codes with the Highest Percentage of Population Employed in Installation, Maintenance & Repair in Arvada, CO
RELATED REPORTS & OPTIONS
Installation, Maintenance & Repair
Arvada
Compare Zip Codes
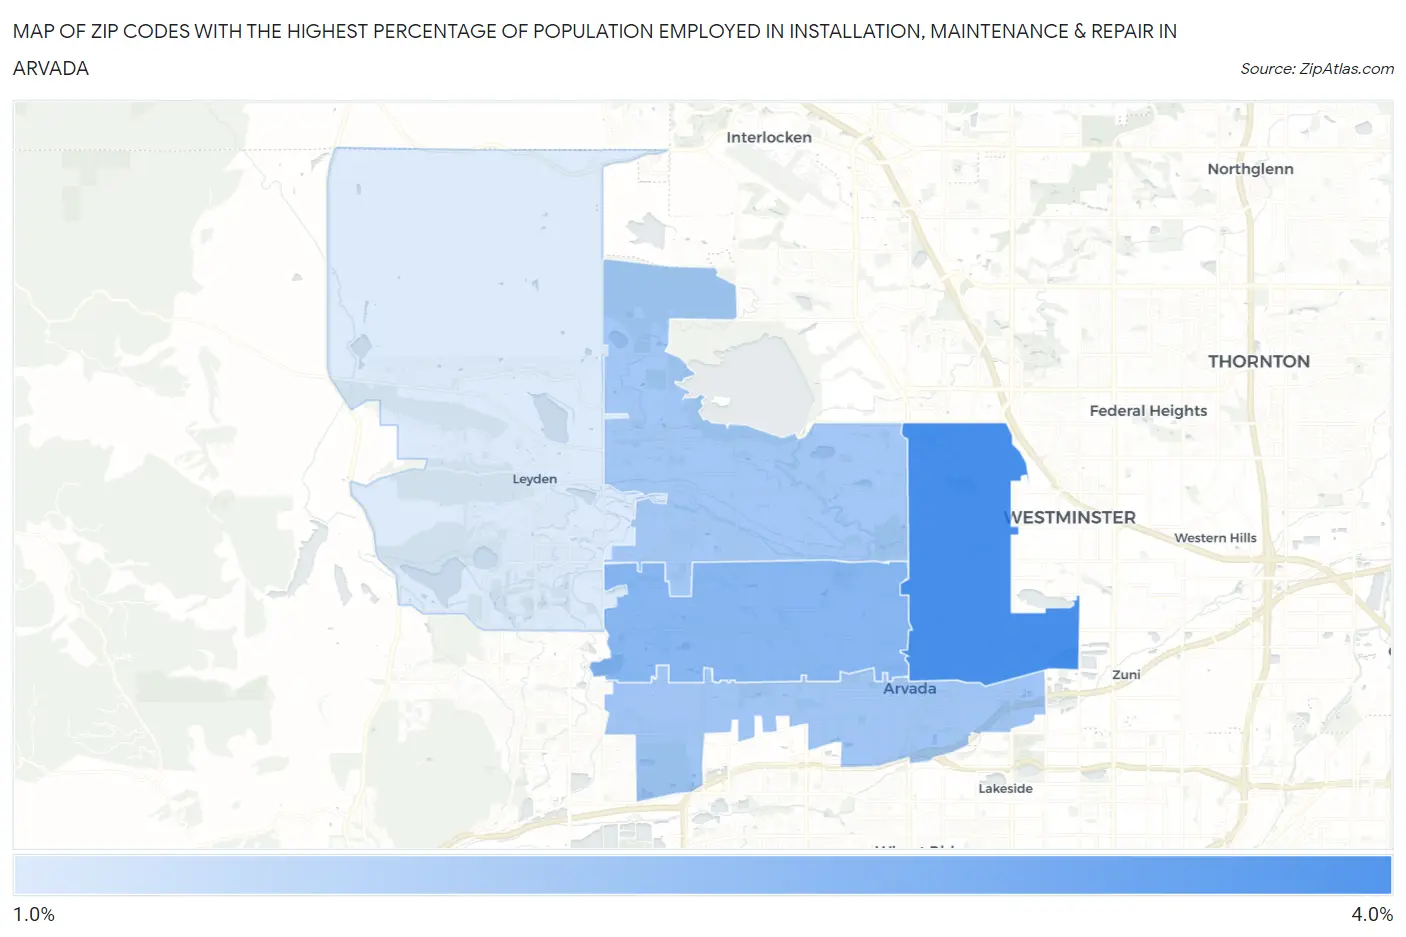
Map of Zip Codes with the Highest Percentage of Population Employed in Installation, Maintenance & Repair in Arvada
1.3%
3.3%
Zip Codes with the Highest Percentage of Population Employed in Installation, Maintenance & Repair in Arvada, CO
| Zip Code | % Employed | vs State | vs National | |
| 1. | 80003 | 3.3% | 2.8%(+0.515)#194 | 3.1%(+0.269)#15,377 |
| 2. | 80004 | 2.4% | 2.8%(-0.380)#268 | 3.1%(-0.626)#19,840 |
| 3. | 80002 | 2.1% | 2.8%(-0.710)#301 | 3.1%(-0.956)#21,491 |
| 4. | 80005 | 2.1% | 2.8%(-0.735)#302 | 3.1%(-0.981)#21,598 |
| 5. | 80007 | 1.3% | 2.8%(-1.53)#359 | 3.1%(-1.78)#24,912 |
1
Common Questions
What are the Top 3 Zip Codes with the Highest Percentage of Population Employed in Installation, Maintenance & Repair in Arvada, CO?
Top 3 Zip Codes with the Highest Percentage of Population Employed in Installation, Maintenance & Repair in Arvada, CO are:
What zip code has the Highest Percentage of Population Employed in Installation, Maintenance & Repair in Arvada, CO?
80003 has the Highest Percentage of Population Employed in Installation, Maintenance & Repair in Arvada, CO with 3.3%.
What is the Percentage of Population Employed in Installation, Maintenance & Repair in Arvada, CO?
Percentage of Population Employed in Installation, Maintenance & Repair in Arvada is 2.4%.
What is the Percentage of Population Employed in Installation, Maintenance & Repair in Colorado?
Percentage of Population Employed in Installation, Maintenance & Repair in Colorado is 2.8%.
What is the Percentage of Population Employed in Installation, Maintenance & Repair in the United States?
Percentage of Population Employed in Installation, Maintenance & Repair in the United States is 3.1%.