Zip Codes with the Highest Percentage of Population Employed in Legal Services & Support in Longmont, CO
RELATED REPORTS & OPTIONS
Legal Services & Support
Longmont
Compare Zip Codes
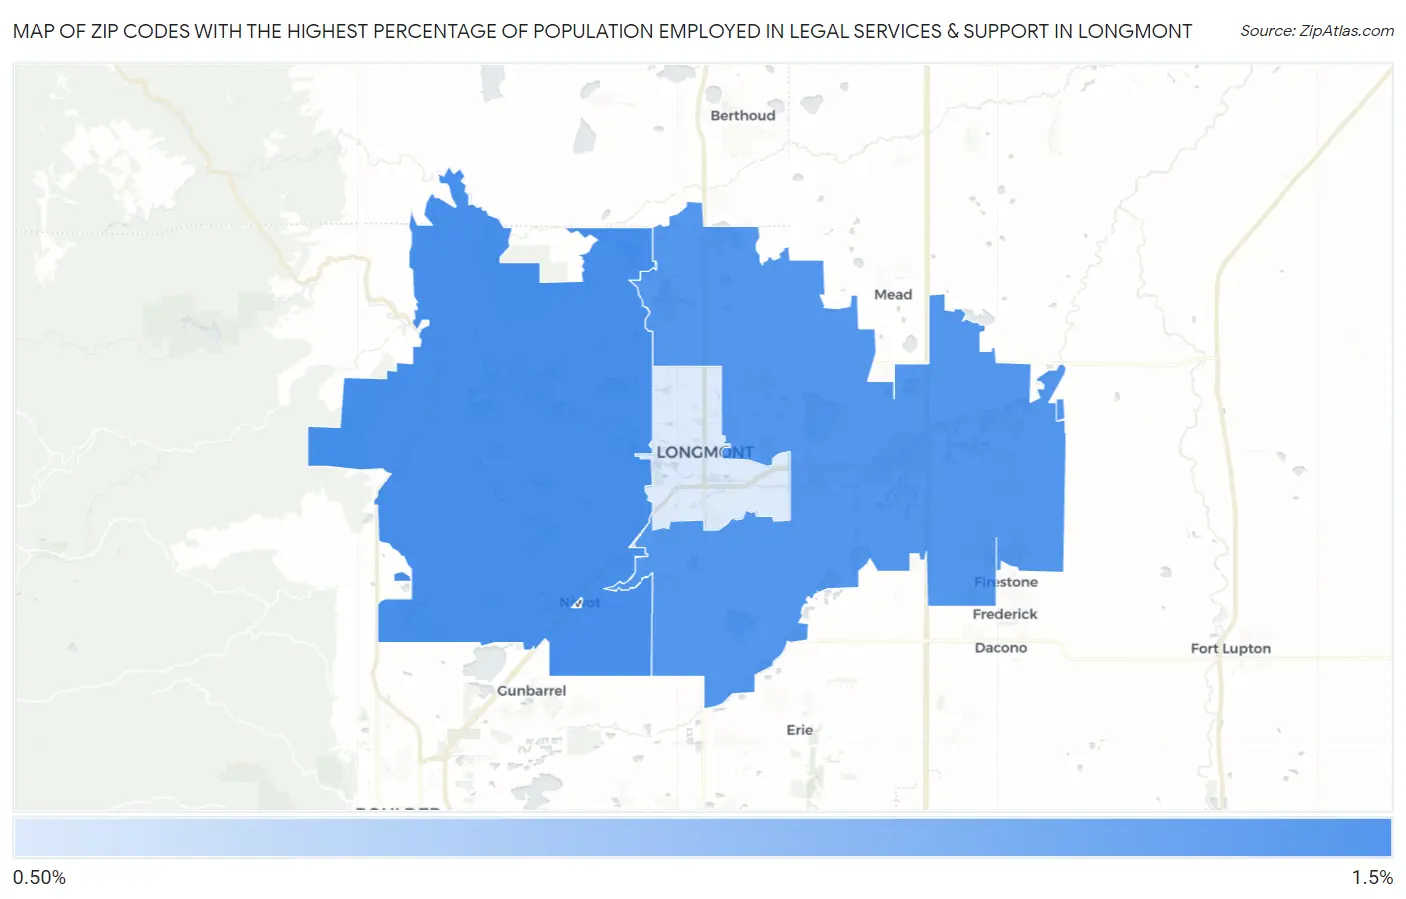
Map of Zip Codes with the Highest Percentage of Population Employed in Legal Services & Support in Longmont
0.78%
1.4%
Zip Codes with the Highest Percentage of Population Employed in Legal Services & Support in Longmont, CO
| Zip Code | % Employed | vs State | vs National | |
| 1. | 80503 | 1.4% | 1.2%(+0.187)#115 | 1.2%(+0.188)#5,597 |
| 2. | 80504 | 1.3% | 1.2%(+0.140)#120 | 1.2%(+0.140)#5,817 |
| 3. | 80501 | 0.78% | 1.2%(-0.409)#191 | 1.2%(-0.409)#9,688 |
1
Common Questions
What are the Top Zip Codes with the Highest Percentage of Population Employed in Legal Services & Support in Longmont, CO?
Top Zip Codes with the Highest Percentage of Population Employed in Legal Services & Support in Longmont, CO are:
What zip code has the Highest Percentage of Population Employed in Legal Services & Support in Longmont, CO?
80503 has the Highest Percentage of Population Employed in Legal Services & Support in Longmont, CO with 1.4%.
What is the Percentage of Population Employed in Legal Services & Support in Longmont, CO?
Percentage of Population Employed in Legal Services & Support in Longmont is 1.2%.
What is the Percentage of Population Employed in Legal Services & Support in Colorado?
Percentage of Population Employed in Legal Services & Support in Colorado is 1.2%.
What is the Percentage of Population Employed in Legal Services & Support in the United States?
Percentage of Population Employed in Legal Services & Support in the United States is 1.2%.