Zip Codes with the Highest Percentage of Population Employed in Legal Services & Support in Broomfield, CO
RELATED REPORTS & OPTIONS
Legal Services & Support
Broomfield
Compare Zip Codes
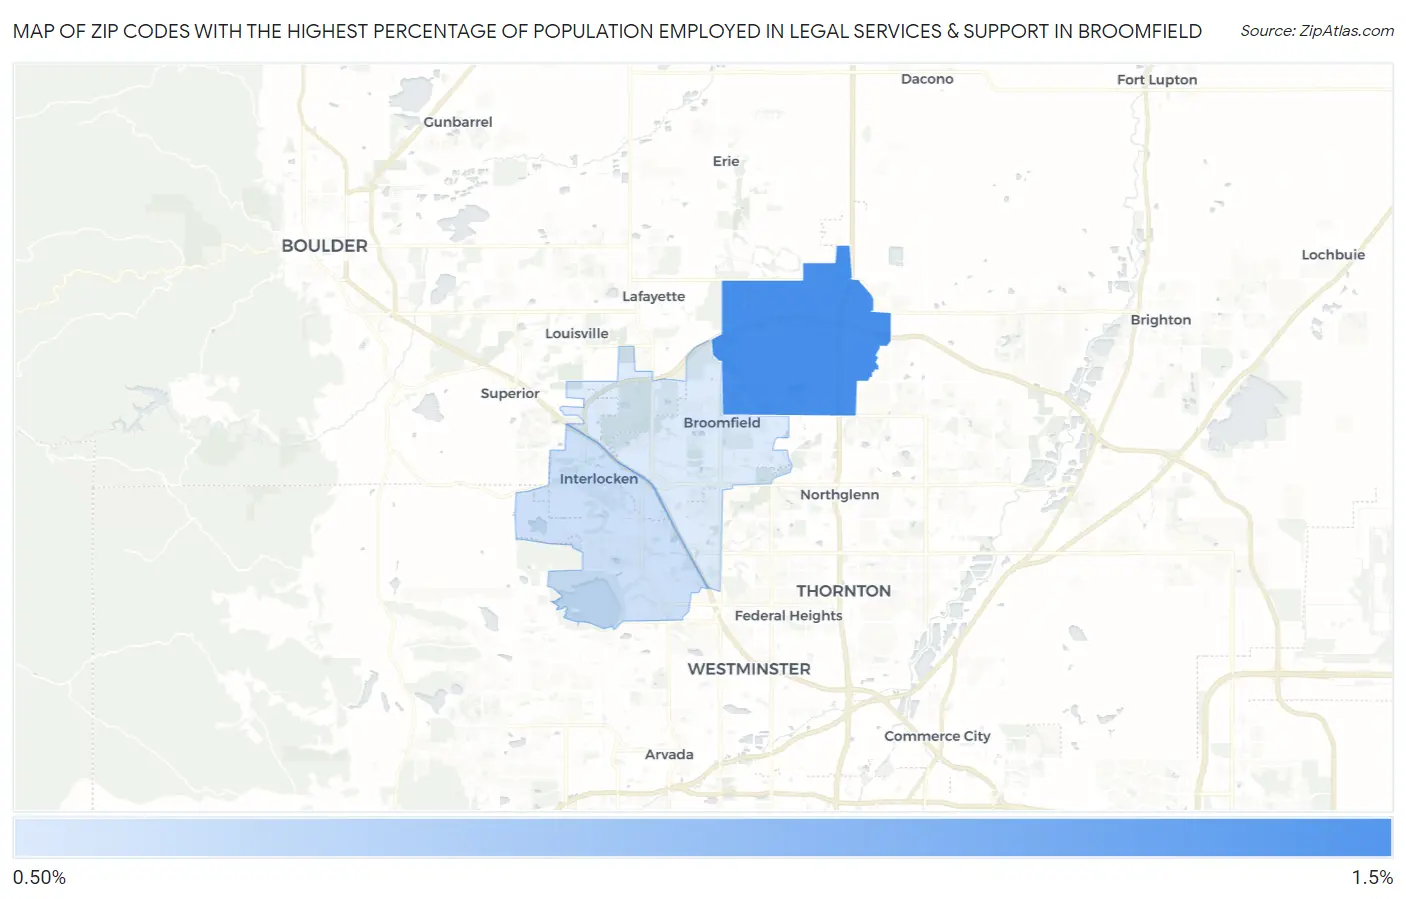
Map of Zip Codes with the Highest Percentage of Population Employed in Legal Services & Support in Broomfield
0.86%
1.4%
Zip Codes with the Highest Percentage of Population Employed in Legal Services & Support in Broomfield, CO
| Zip Code | % Employed | vs State | vs National | |
| 1. | 80023 | 1.4% | 1.2%(+0.228)#111 | 1.2%(+0.229)#5,411 |
| 2. | 80021 | 0.92% | 1.2%(-0.267)#166 | 1.2%(-0.267)#8,454 |
| 3. | 80020 | 0.86% | 1.2%(-0.326)#177 | 1.2%(-0.325)#8,942 |
1
Common Questions
What are the Top Zip Codes with the Highest Percentage of Population Employed in Legal Services & Support in Broomfield, CO?
Top Zip Codes with the Highest Percentage of Population Employed in Legal Services & Support in Broomfield, CO are:
What zip code has the Highest Percentage of Population Employed in Legal Services & Support in Broomfield, CO?
80023 has the Highest Percentage of Population Employed in Legal Services & Support in Broomfield, CO with 1.4%.
What is the Percentage of Population Employed in Legal Services & Support in Broomfield, CO?
Percentage of Population Employed in Legal Services & Support in Broomfield is 1.2%.
What is the Percentage of Population Employed in Legal Services & Support in Colorado?
Percentage of Population Employed in Legal Services & Support in Colorado is 1.2%.
What is the Percentage of Population Employed in Legal Services & Support in the United States?
Percentage of Population Employed in Legal Services & Support in the United States is 1.2%.