Zip Codes with the Highest Percentage of Households Heated by Bottled Gas / Liquid Propane in Whittier, CA
RELATED REPORTS & OPTIONS
Bottled Gas / LP Heating
Whittier
Compare Zip Codes
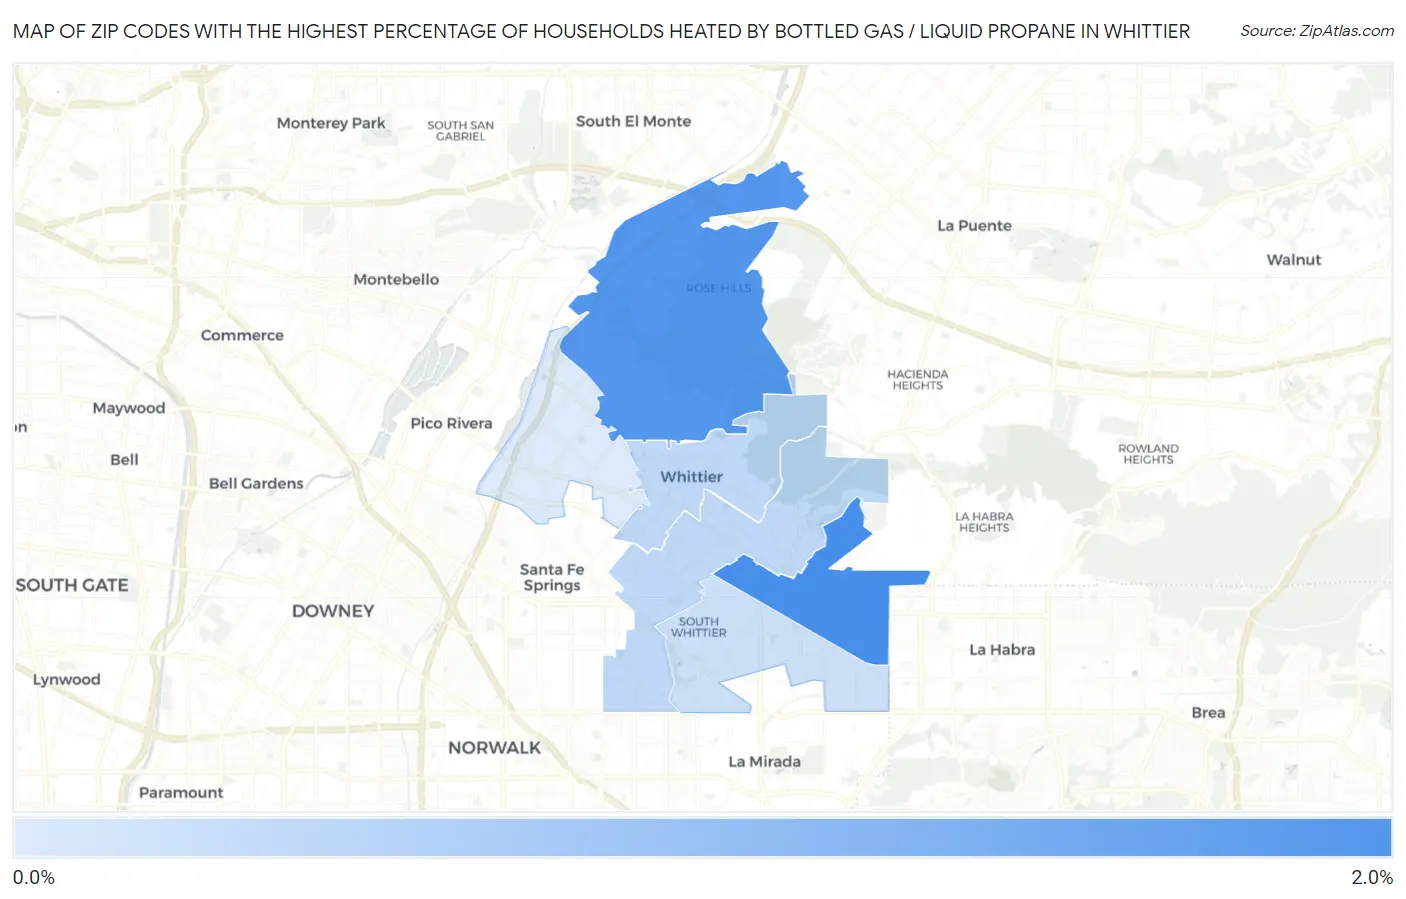
Map of Zip Codes with the Highest Percentage of Households Heated by Bottled Gas / Liquid Propane in Whittier
0.0%
2.0%
Zip Codes with the Highest Percentage of Households Heated by Bottled Gas / Liquid Propane in Whittier, CA
| Zip Code | Bottled Gas / LP Heating | vs State | vs National | |
| 1. | 90603 | 1.9% | 3.5%(-1.60)#988 | 4.9%(-3.00)#23,506 |
| 2. | 90601 | 1.8% | 3.5%(-1.70)#1,025 | 4.9%(-3.10)#23,741 |
| 3. | 90605 | 1.1% | 3.5%(-2.40)#1,345 | 4.9%(-3.80)#26,180 |
| 4. | 90602 | 1.1% | 3.5%(-2.40)#1,362 | 4.9%(-3.80)#26,289 |
| 5. | 90604 | 1.0% | 3.5%(-2.50)#1,395 | 4.9%(-3.90)#26,581 |
| 6. | 90606 | 0.90% | 3.5%(-2.60)#1,449 | 4.9%(-4.00)#27,077 |
1
Common Questions
What are the Top 5 Zip Codes with the Highest Percentage of Households Heated by Bottled Gas / Liquid Propane in Whittier, CA?
Top 5 Zip Codes with the Highest Percentage of Households Heated by Bottled Gas / Liquid Propane in Whittier, CA are:
What zip code has the Highest Percentage of Households Heated by Bottled Gas / Liquid Propane in Whittier, CA?
90603 has the Highest Percentage of Households Heated by Bottled Gas / Liquid Propane in Whittier, CA with 1.9%.
What is the Percentage of Households Heated by Bottled Gas / Liquid Propane in Whittier, CA?
Percentage of Households Heated by Bottled Gas / Liquid Propane in Whittier is 1.5%.
What is the Percentage of Households Heated by Bottled Gas / Liquid Propane in California?
Percentage of Households Heated by Bottled Gas / Liquid Propane in California is 3.5%.
What is the Percentage of Households Heated by Bottled Gas / Liquid Propane in the United States?
Percentage of Households Heated by Bottled Gas / Liquid Propane in the United States is 4.9%.