Zip Codes with the Highest Percentage of Households Heated by Bottled Gas / Liquid Propane in San Bernardino, CA
RELATED REPORTS & OPTIONS
Bottled Gas / LP Heating
San Bernardino
Compare Zip Codes
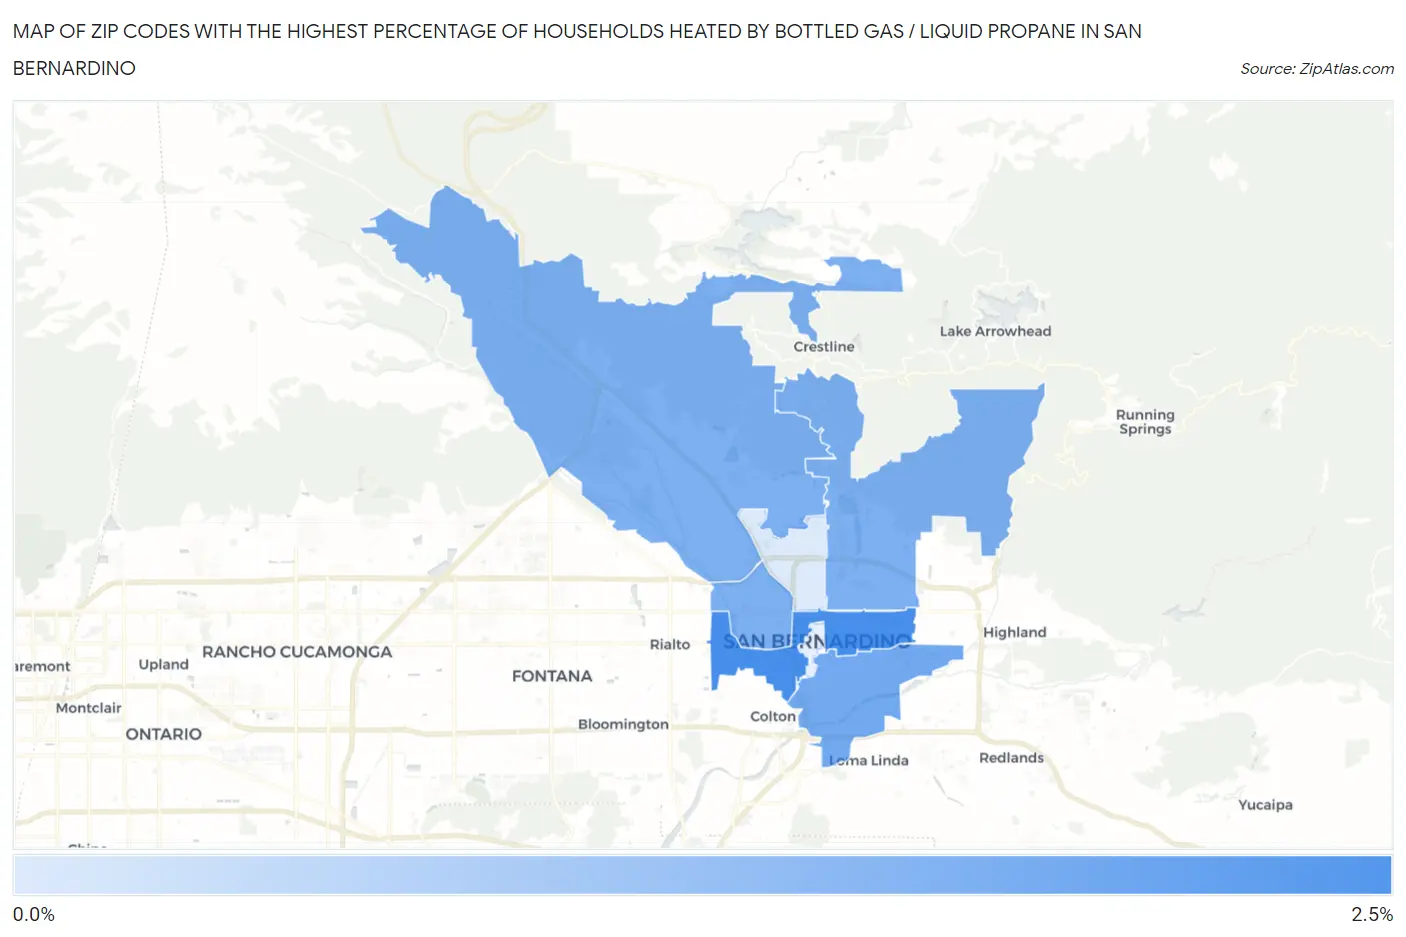
Map of Zip Codes with the Highest Percentage of Households Heated by Bottled Gas / Liquid Propane in San Bernardino
0.50%
2.2%
Zip Codes with the Highest Percentage of Households Heated by Bottled Gas / Liquid Propane in San Bernardino, CA
| Zip Code | Bottled Gas / LP Heating | vs State | vs National | |
| 1. | 92410 | 2.2% | 3.5%(-1.30)#858 | 4.9%(-2.70)#22,579 |
| 2. | 92408 | 1.7% | 3.5%(-1.80)#1,073 | 4.9%(-3.20)#24,145 |
| 3. | 92407 | 1.6% | 3.5%(-1.90)#1,081 | 4.9%(-3.30)#24,252 |
| 4. | 92404 | 1.6% | 3.5%(-1.90)#1,082 | 4.9%(-3.30)#24,258 |
| 5. | 92411 | 1.6% | 3.5%(-1.90)#1,118 | 4.9%(-3.30)#24,401 |
| 6. | 92405 | 0.50% | 3.5%(-3.00)#1,564 | 4.9%(-4.40)#28,553 |
1
Common Questions
What are the Top 5 Zip Codes with the Highest Percentage of Households Heated by Bottled Gas / Liquid Propane in San Bernardino, CA?
Top 5 Zip Codes with the Highest Percentage of Households Heated by Bottled Gas / Liquid Propane in San Bernardino, CA are:
What zip code has the Highest Percentage of Households Heated by Bottled Gas / Liquid Propane in San Bernardino, CA?
92410 has the Highest Percentage of Households Heated by Bottled Gas / Liquid Propane in San Bernardino, CA with 2.2%.
What is the Percentage of Households Heated by Bottled Gas / Liquid Propane in San Bernardino, CA?
Percentage of Households Heated by Bottled Gas / Liquid Propane in San Bernardino is 1.0%.
What is the Percentage of Households Heated by Bottled Gas / Liquid Propane in California?
Percentage of Households Heated by Bottled Gas / Liquid Propane in California is 3.5%.
What is the Percentage of Households Heated by Bottled Gas / Liquid Propane in the United States?
Percentage of Households Heated by Bottled Gas / Liquid Propane in the United States is 4.9%.