Zip Codes with the Highest Percentage of Households Heated by Bottled Gas / Liquid Propane in Trabuco Canyon, CA
RELATED REPORTS & OPTIONS
Bottled Gas / LP Heating
Trabuco Canyon
Compare Zip Codes
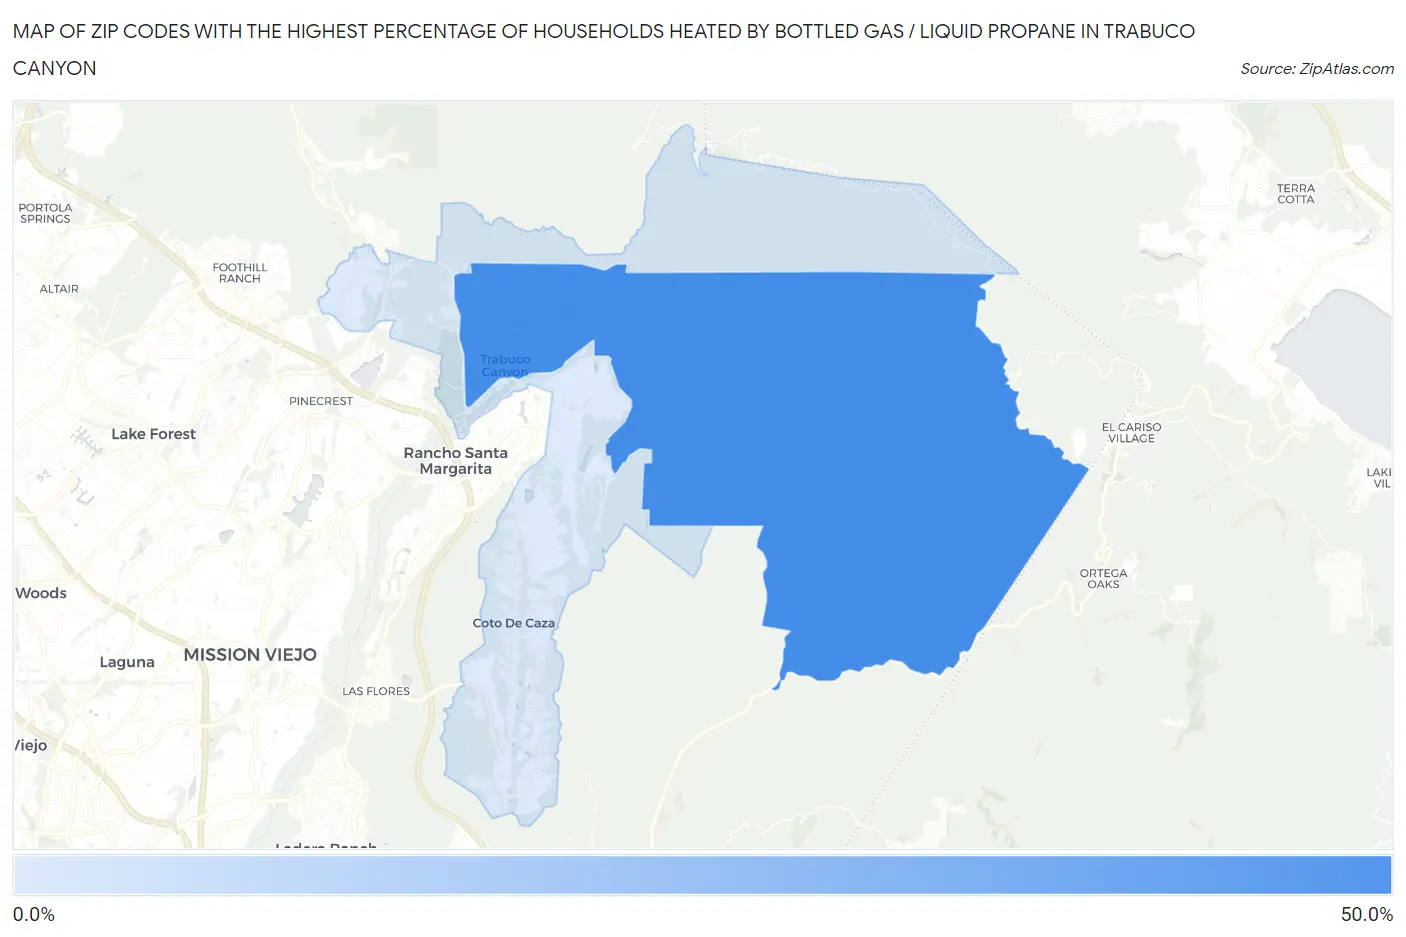
Map of Zip Codes with the Highest Percentage of Households Heated by Bottled Gas / Liquid Propane in Trabuco Canyon
2.4%
46.2%
Zip Codes with the Highest Percentage of Households Heated by Bottled Gas / Liquid Propane in Trabuco Canyon, CA
| Zip Code | Bottled Gas / LP Heating | vs State | vs National | |
| 1. | 92678 | 46.2% | 3.5%(+42.7)#113 | 4.9%(+41.3)#2,699 |
| 2. | 92679 | 2.4% | 3.5%(-1.10)#815 | 4.9%(-2.50)#22,159 |
1
Common Questions
What are the Top Zip Codes with the Highest Percentage of Households Heated by Bottled Gas / Liquid Propane in Trabuco Canyon, CA?
Top Zip Codes with the Highest Percentage of Households Heated by Bottled Gas / Liquid Propane in Trabuco Canyon, CA are:
What zip code has the Highest Percentage of Households Heated by Bottled Gas / Liquid Propane in Trabuco Canyon, CA?
92678 has the Highest Percentage of Households Heated by Bottled Gas / Liquid Propane in Trabuco Canyon, CA with 46.2%.
What is the Percentage of Households Heated by Bottled Gas / Liquid Propane in Trabuco Canyon, CA?
Percentage of Households Heated by Bottled Gas / Liquid Propane in Trabuco Canyon is 52.3%.
What is the Percentage of Households Heated by Bottled Gas / Liquid Propane in California?
Percentage of Households Heated by Bottled Gas / Liquid Propane in California is 3.5%.
What is the Percentage of Households Heated by Bottled Gas / Liquid Propane in the United States?
Percentage of Households Heated by Bottled Gas / Liquid Propane in the United States is 4.9%.