Zip Codes with the Highest Percentage of Population Employed in Farming, Fishing & Forestry in Whittier, CA
RELATED REPORTS & OPTIONS
Farming, Fishing & Forestry
Whittier
Compare Zip Codes
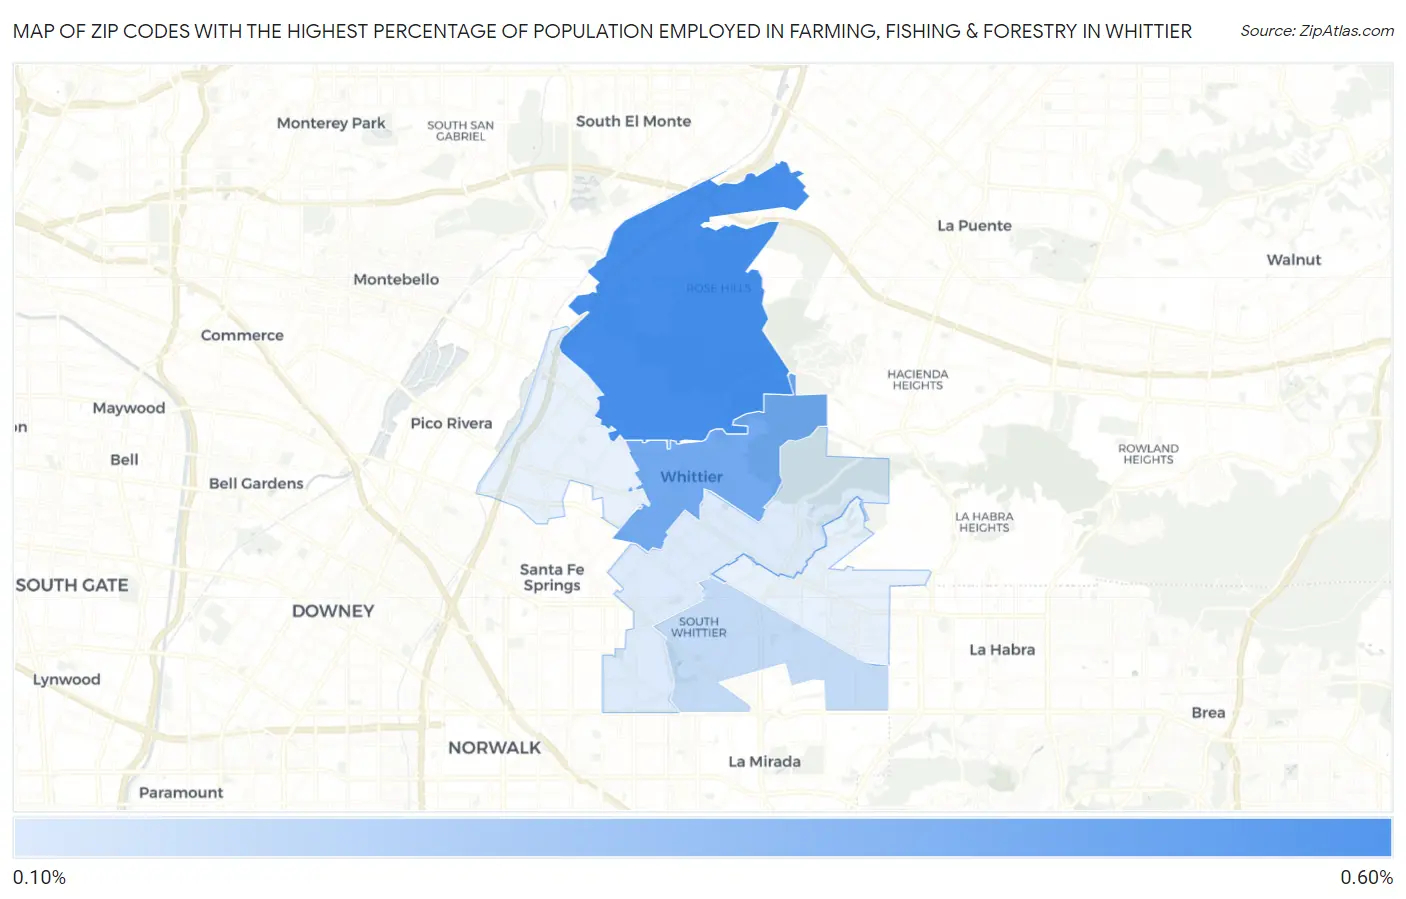
Map of Zip Codes with the Highest Percentage of Population Employed in Farming, Fishing & Forestry in Whittier
0.0%
0.60%
Zip Codes with the Highest Percentage of Population Employed in Farming, Fishing & Forestry in Whittier, CA
| Zip Code | % Employed | vs State | vs National | |
| 1. | 90601 | 0.58% | 1.4%(-0.828)#642 | 0.61%(-0.023)#12,182 |
| 2. | 90602 | 0.46% | 1.4%(-0.946)#706 | 0.61%(-0.141)#13,147 |
| 3. | 90604 | 0.24% | 1.4%(-1.17)#911 | 0.61%(-0.365)#15,542 |
| 4. | 90605 | 0.17% | 1.4%(-1.24)#985 | 0.61%(-0.437)#16,594 |
1
Common Questions
What are the Top 5 Zip Codes with the Highest Percentage of Population Employed in Farming, Fishing & Forestry in Whittier, CA?
Top 5 Zip Codes with the Highest Percentage of Population Employed in Farming, Fishing & Forestry in Whittier, CA are:
What zip code has the Highest Percentage of Population Employed in Farming, Fishing & Forestry in Whittier, CA?
90601 has the Highest Percentage of Population Employed in Farming, Fishing & Forestry in Whittier, CA with 0.58%.
What is the Percentage of Population Employed in Farming, Fishing & Forestry in Whittier, CA?
Percentage of Population Employed in Farming, Fishing & Forestry in Whittier is 0.32%.
What is the Percentage of Population Employed in Farming, Fishing & Forestry in California?
Percentage of Population Employed in Farming, Fishing & Forestry in California is 1.4%.
What is the Percentage of Population Employed in Farming, Fishing & Forestry in the United States?
Percentage of Population Employed in Farming, Fishing & Forestry in the United States is 0.61%.