Zip Codes with the Highest Percentage of Population Employed in Farming, Fishing & Forestry in Citrus Heights, CA
RELATED REPORTS & OPTIONS
Farming, Fishing & Forestry
Citrus Heights
Compare Zip Codes
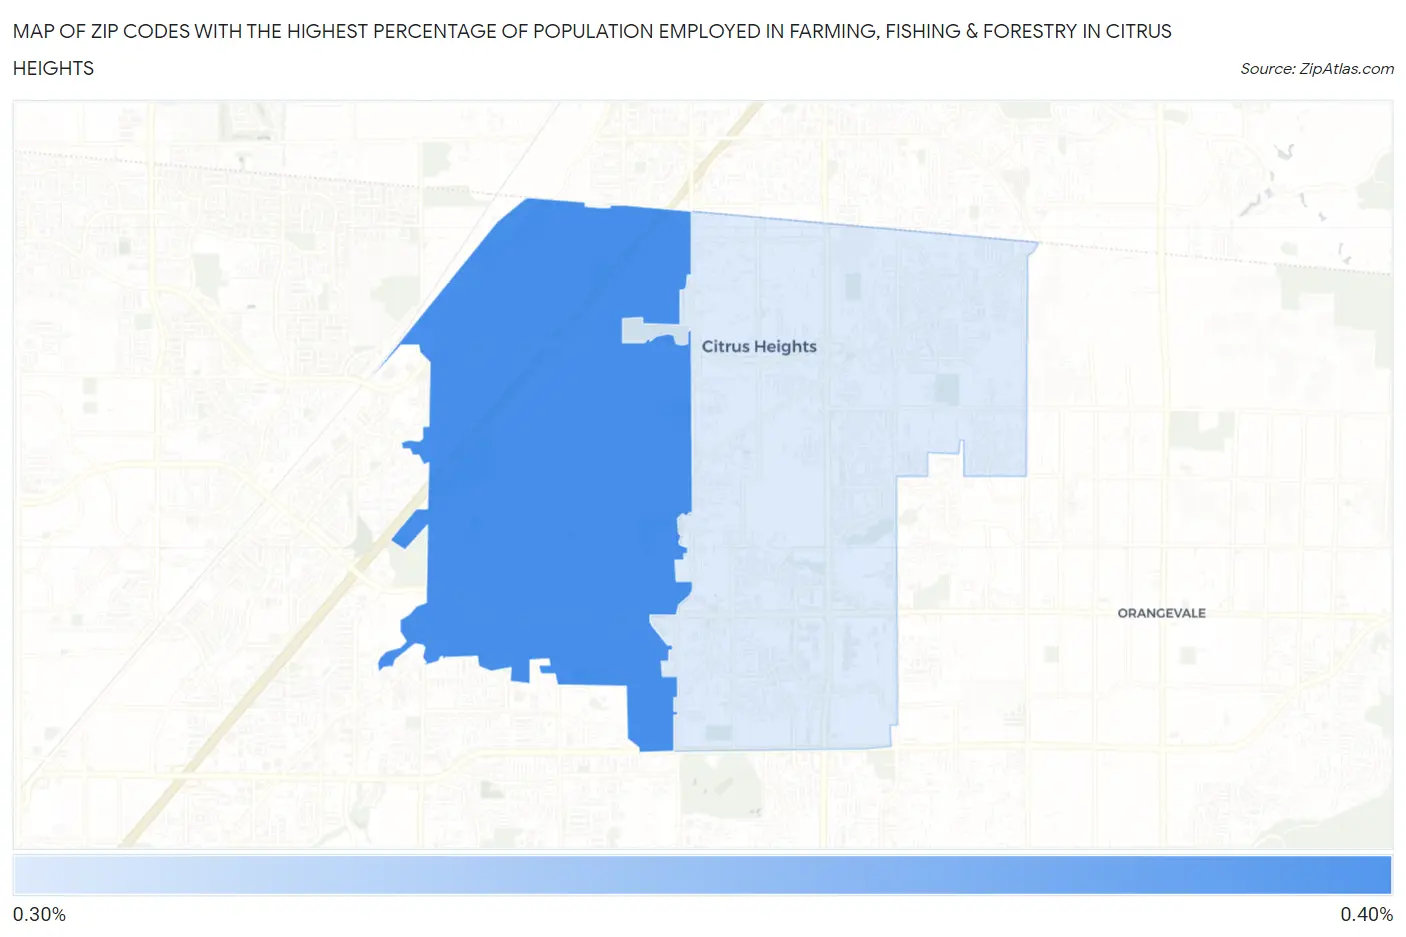
Map of Zip Codes with the Highest Percentage of Population Employed in Farming, Fishing & Forestry in Citrus Heights
0.34%
0.37%
Zip Codes with the Highest Percentage of Population Employed in Farming, Fishing & Forestry in Citrus Heights, CA
| Zip Code | % Employed | vs State | vs National | |
| 1. | 95621 | 0.37% | 1.4%(-1.04)#781 | 0.61%(-0.235)#14,039 |
| 2. | 95610 | 0.34% | 1.4%(-1.07)#809 | 0.61%(-0.267)#14,388 |
1
Common Questions
What are the Top Zip Codes with the Highest Percentage of Population Employed in Farming, Fishing & Forestry in Citrus Heights, CA?
Top Zip Codes with the Highest Percentage of Population Employed in Farming, Fishing & Forestry in Citrus Heights, CA are:
What zip code has the Highest Percentage of Population Employed in Farming, Fishing & Forestry in Citrus Heights, CA?
95621 has the Highest Percentage of Population Employed in Farming, Fishing & Forestry in Citrus Heights, CA with 0.37%.
What is the Percentage of Population Employed in Farming, Fishing & Forestry in Citrus Heights, CA?
Percentage of Population Employed in Farming, Fishing & Forestry in Citrus Heights is 0.36%.
What is the Percentage of Population Employed in Farming, Fishing & Forestry in California?
Percentage of Population Employed in Farming, Fishing & Forestry in California is 1.4%.
What is the Percentage of Population Employed in Farming, Fishing & Forestry in the United States?
Percentage of Population Employed in Farming, Fishing & Forestry in the United States is 0.61%.