Zip Codes with the Highest Percentage of Population Employed in Administrative & Support Services in Peoria, AZ
RELATED REPORTS & OPTIONS
Administrative & Support Services
Peoria
Compare Zip Codes
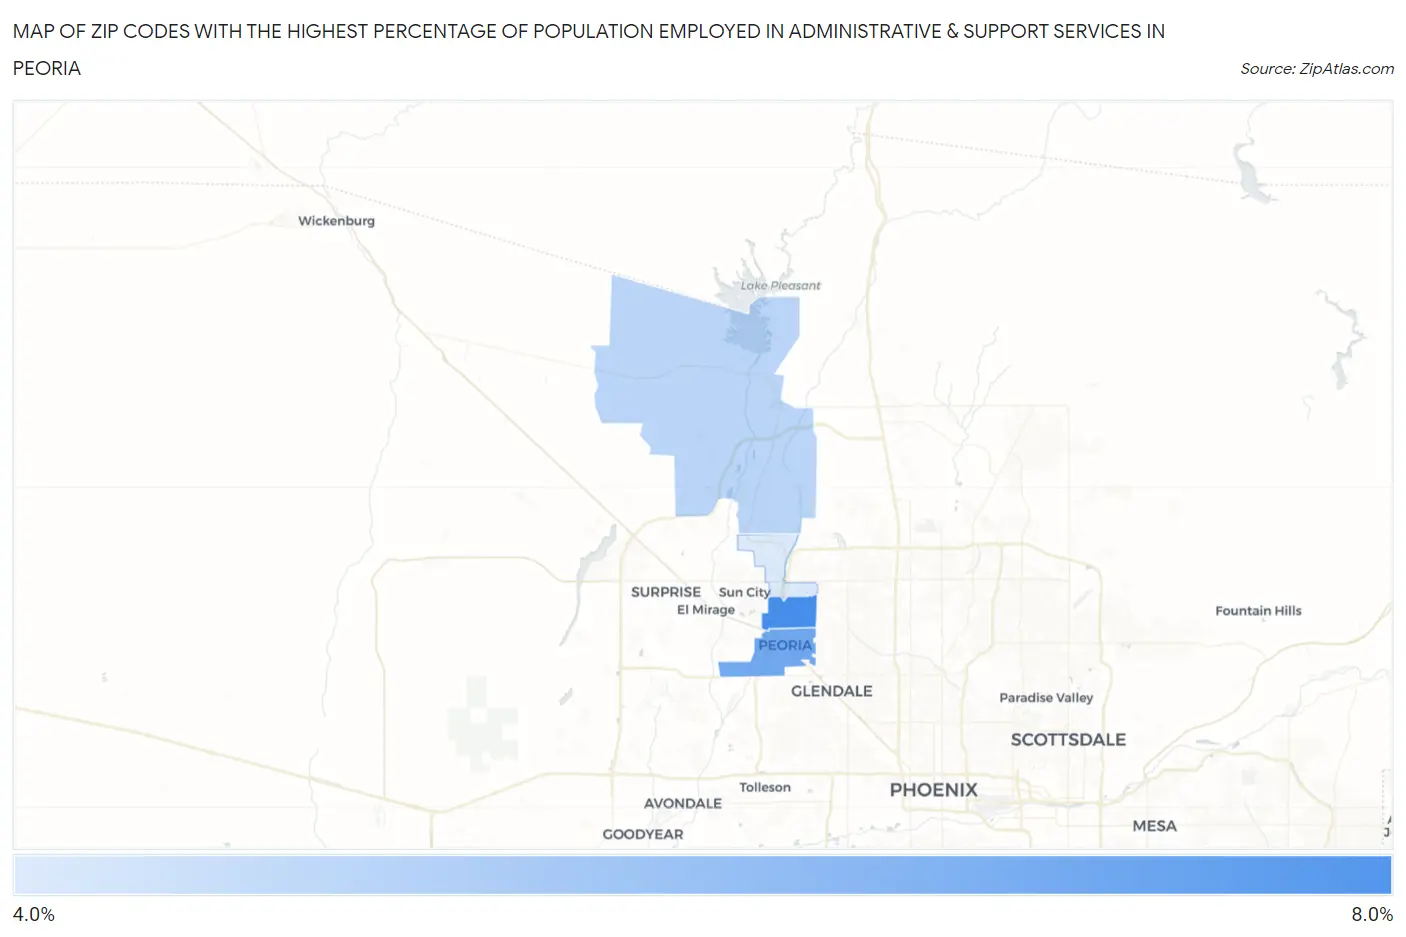
Map of Zip Codes with the Highest Percentage of Population Employed in Administrative & Support Services in Peoria
4.1%
6.7%
Zip Codes with the Highest Percentage of Population Employed in Administrative & Support Services in Peoria, AZ
| Zip Code | % Employed | vs State | vs National | |
| 1. | 85381 | 6.7% | 5.4%(+1.35)#85 | 4.1%(+2.56)#3,612 |
| 2. | 85345 | 5.9% | 5.4%(+0.578)#115 | 4.1%(+1.78)#4,912 |
| 3. | 85383 | 4.7% | 5.4%(-0.627)#162 | 4.1%(+0.578)#7,942 |
| 4. | 85382 | 4.1% | 5.4%(-1.23)#195 | 4.1%(-0.024)#10,138 |
1
Common Questions
What are the Top 3 Zip Codes with the Highest Percentage of Population Employed in Administrative & Support Services in Peoria, AZ?
Top 3 Zip Codes with the Highest Percentage of Population Employed in Administrative & Support Services in Peoria, AZ are:
What zip code has the Highest Percentage of Population Employed in Administrative & Support Services in Peoria, AZ?
85381 has the Highest Percentage of Population Employed in Administrative & Support Services in Peoria, AZ with 6.7%.
What is the Percentage of Population Employed in Administrative & Support Services in Peoria, AZ?
Percentage of Population Employed in Administrative & Support Services in Peoria is 5.2%.
What is the Percentage of Population Employed in Administrative & Support Services in Arizona?
Percentage of Population Employed in Administrative & Support Services in Arizona is 5.4%.
What is the Percentage of Population Employed in Administrative & Support Services in the United States?
Percentage of Population Employed in Administrative & Support Services in the United States is 4.1%.