Zip Codes with the Highest Percentage of Population Employed in Computer, Engineering & Science in Peoria, AZ
RELATED REPORTS & OPTIONS
Computer, Engineering & Science
Peoria
Compare Zip Codes
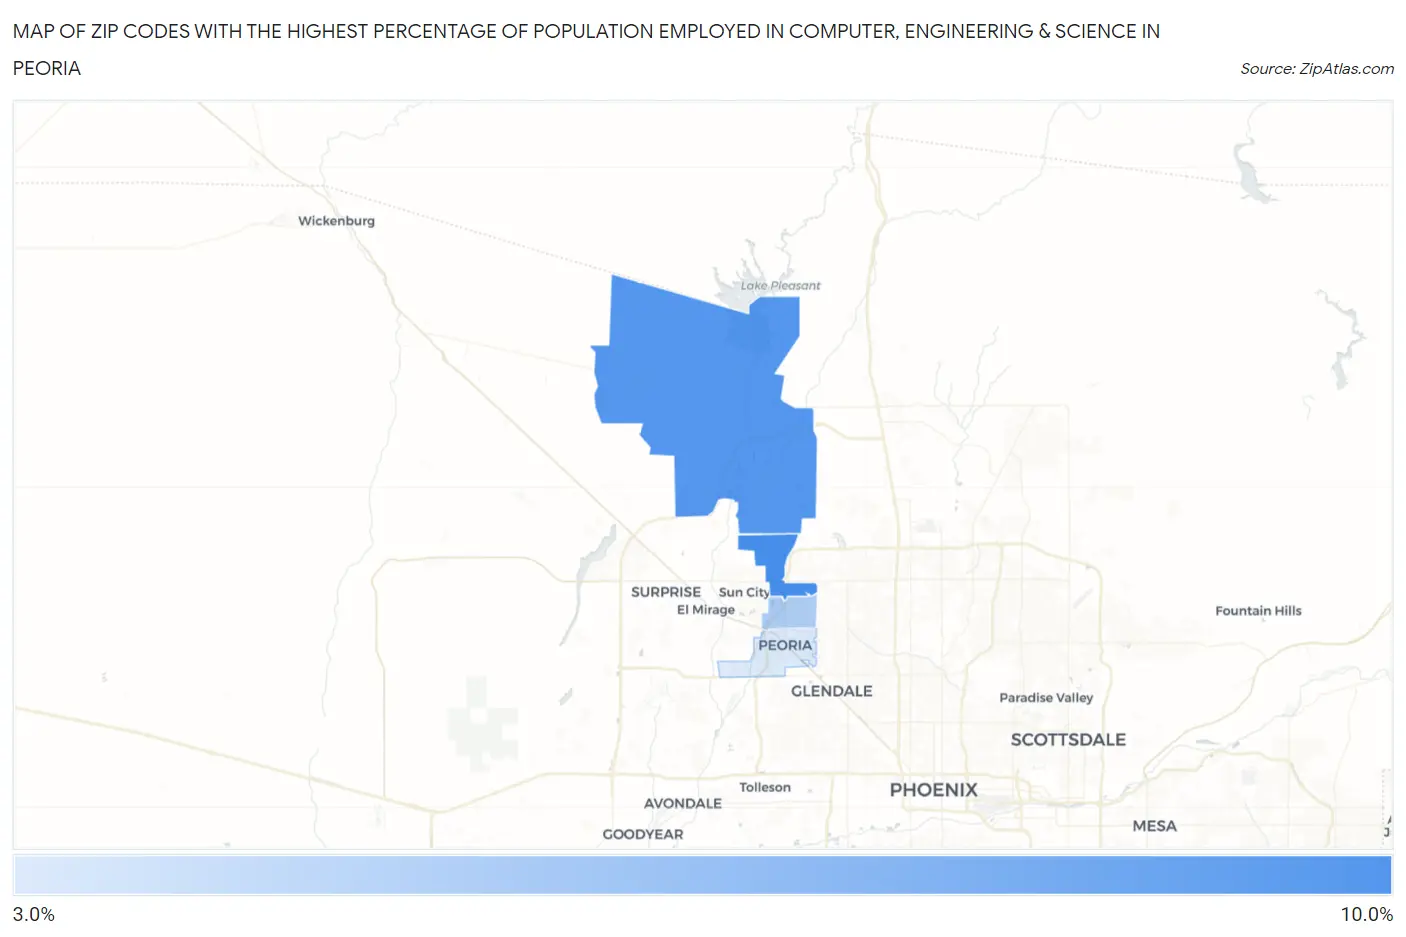
Map of Zip Codes with the Highest Percentage of Population Employed in Computer, Engineering & Science in Peoria
4.0%
8.8%
Zip Codes with the Highest Percentage of Population Employed in Computer, Engineering & Science in Peoria, AZ
| Zip Code | % Employed | vs State | vs National | |
| 1. | 85382 | 8.8% | 6.8%(+2.00)#70 | 6.8%(+2.02)#4,280 |
| 2. | 85383 | 8.3% | 6.8%(+1.54)#81 | 6.8%(+1.55)#4,836 |
| 3. | 85381 | 5.4% | 6.8%(-1.38)#149 | 6.8%(-1.36)#10,328 |
| 4. | 85345 | 4.0% | 6.8%(-2.83)#216 | 6.8%(-2.81)#14,638 |
1
Common Questions
What are the Top 3 Zip Codes with the Highest Percentage of Population Employed in Computer, Engineering & Science in Peoria, AZ?
Top 3 Zip Codes with the Highest Percentage of Population Employed in Computer, Engineering & Science in Peoria, AZ are:
What zip code has the Highest Percentage of Population Employed in Computer, Engineering & Science in Peoria, AZ?
85382 has the Highest Percentage of Population Employed in Computer, Engineering & Science in Peoria, AZ with 8.8%.
What is the Percentage of Population Employed in Computer, Engineering & Science in Peoria, AZ?
Percentage of Population Employed in Computer, Engineering & Science in Peoria is 6.8%.
What is the Percentage of Population Employed in Computer, Engineering & Science in Arizona?
Percentage of Population Employed in Computer, Engineering & Science in Arizona is 6.8%.
What is the Percentage of Population Employed in Computer, Engineering & Science in the United States?
Percentage of Population Employed in Computer, Engineering & Science in the United States is 6.8%.