Zip Codes with the Highest Percentage of Population with a Degree in Liberal Arts and History in Peoria, AZ
RELATED REPORTS & OPTIONS
Liberal Arts and History
Peoria
Compare Zip Codes
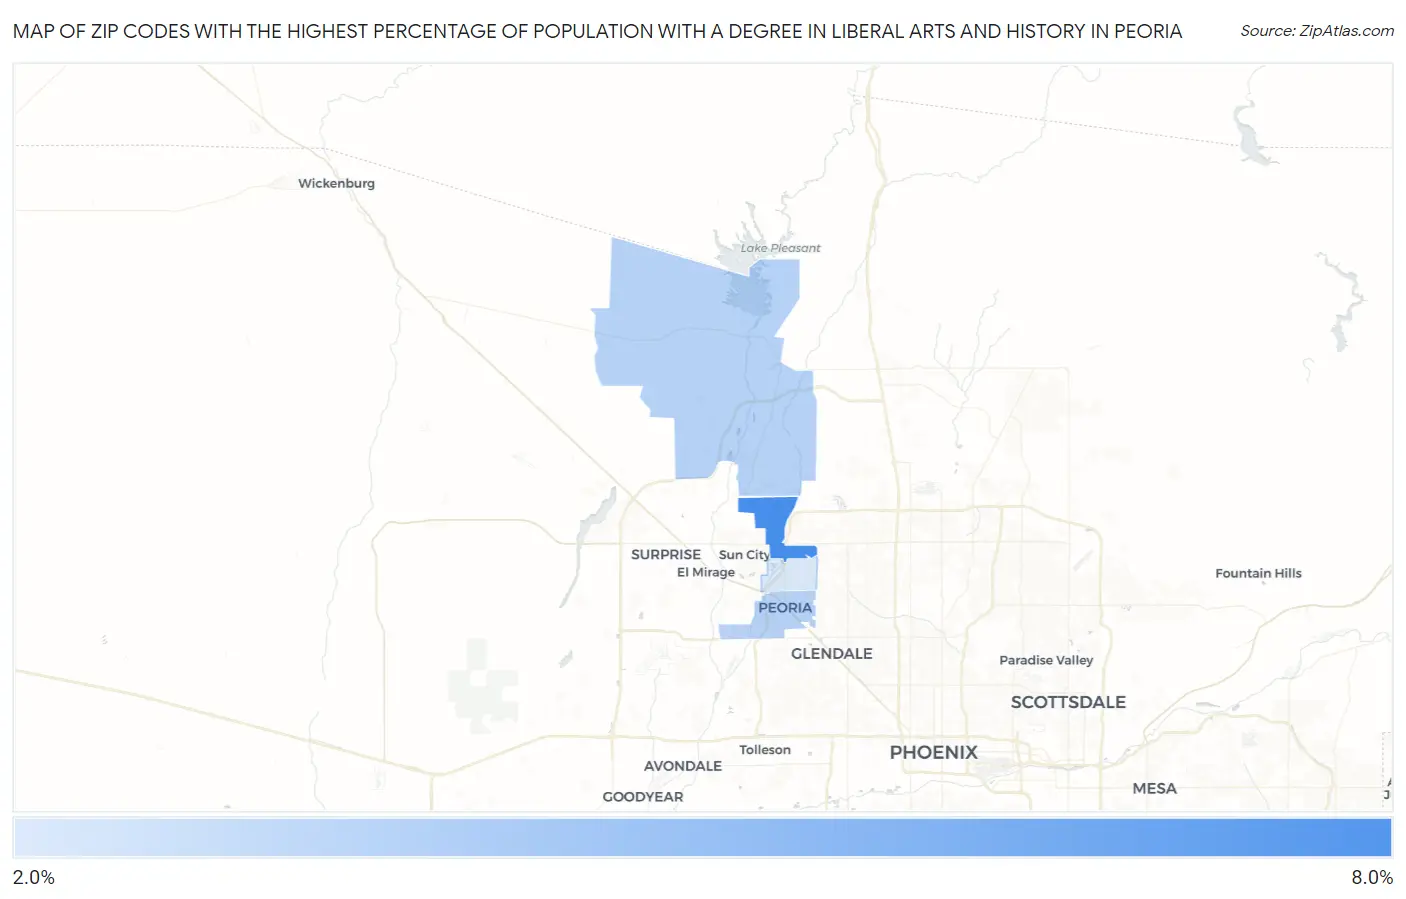
Map of Zip Codes with the Highest Percentage of Population with a Degree in Liberal Arts and History in Peoria
2.5%
6.6%
Zip Codes with the Highest Percentage of Population with a Degree in Liberal Arts and History in Peoria, AZ
| Zip Code | % Graduates | vs State | vs National | |
| 1. | 85382 | 6.6% | 4.3%(+2.38)#70 | 4.9%(+1.76)#7,077 |
| 2. | 85383 | 3.5% | 4.3%(-0.730)#204 | 4.9%(-1.35)#16,506 |
| 3. | 85345 | 3.5% | 4.3%(-0.748)#208 | 4.9%(-1.37)#16,578 |
| 4. | 85381 | 2.5% | 4.3%(-1.78)#260 | 4.9%(-2.40)#20,088 |
1
Common Questions
What are the Top 3 Zip Codes with the Highest Percentage of Population with a Degree in Liberal Arts and History in Peoria, AZ?
Top 3 Zip Codes with the Highest Percentage of Population with a Degree in Liberal Arts and History in Peoria, AZ are:
What zip code has the Highest Percentage of Population with a Degree in Liberal Arts and History in Peoria, AZ?
85382 has the Highest Percentage of Population with a Degree in Liberal Arts and History in Peoria, AZ with 6.6%.
What is the Percentage of Population with a Degree in Liberal Arts and History in Peoria, AZ?
Percentage of Population with a Degree in Liberal Arts and History in Peoria is 4.2%.
What is the Percentage of Population with a Degree in Liberal Arts and History in Arizona?
Percentage of Population with a Degree in Liberal Arts and History in Arizona is 4.3%.
What is the Percentage of Population with a Degree in Liberal Arts and History in the United States?
Percentage of Population with a Degree in Liberal Arts and History in the United States is 4.9%.