Zip Codes with the Highest Percentage of Population Employed in Administrative & Support Services in Casa Grande, AZ
RELATED REPORTS & OPTIONS
Administrative & Support Services
Casa Grande
Compare Zip Codes
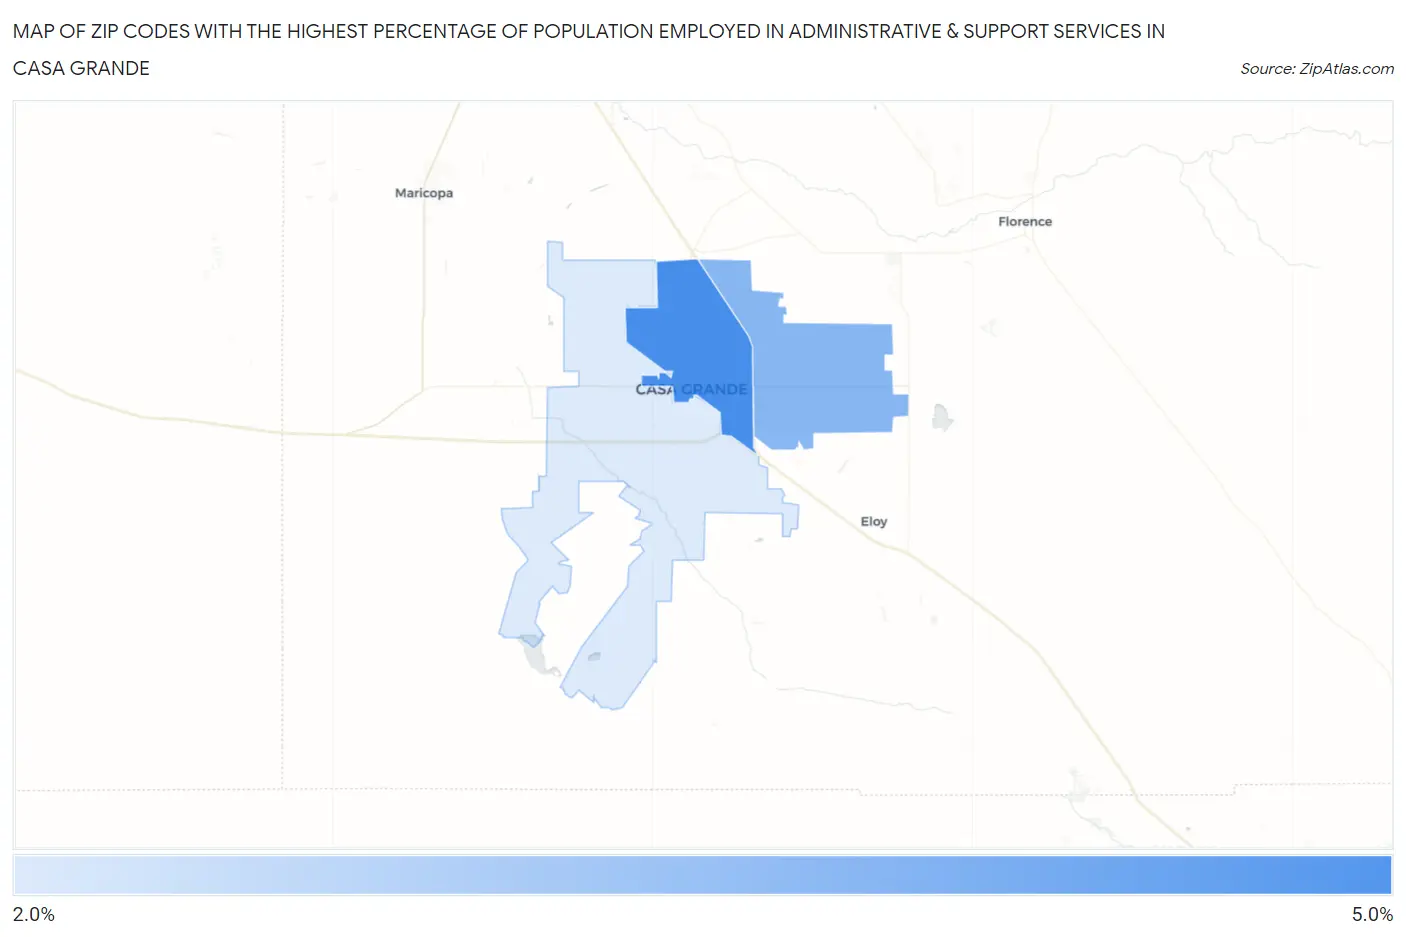
Map of Zip Codes with the Highest Percentage of Population Employed in Administrative & Support Services in Casa Grande
2.9%
4.2%
Zip Codes with the Highest Percentage of Population Employed in Administrative & Support Services in Casa Grande, AZ
| Zip Code | % Employed | vs State | vs National | |
| 1. | 85122 | 4.2% | 5.4%(-1.16)#187 | 4.1%(+0.042)#9,856 |
| 2. | 85194 | 3.6% | 5.4%(-1.70)#225 | 4.1%(-0.500)#12,232 |
| 3. | 85193 | 2.9% | 5.4%(-2.43)#259 | 4.1%(-1.22)#15,861 |
1
Common Questions
What are the Top Zip Codes with the Highest Percentage of Population Employed in Administrative & Support Services in Casa Grande, AZ?
Top Zip Codes with the Highest Percentage of Population Employed in Administrative & Support Services in Casa Grande, AZ are:
What zip code has the Highest Percentage of Population Employed in Administrative & Support Services in Casa Grande, AZ?
85122 has the Highest Percentage of Population Employed in Administrative & Support Services in Casa Grande, AZ with 4.2%.
What is the Percentage of Population Employed in Administrative & Support Services in Casa Grande, AZ?
Percentage of Population Employed in Administrative & Support Services in Casa Grande is 4.2%.
What is the Percentage of Population Employed in Administrative & Support Services in Arizona?
Percentage of Population Employed in Administrative & Support Services in Arizona is 5.4%.
What is the Percentage of Population Employed in Administrative & Support Services in the United States?
Percentage of Population Employed in Administrative & Support Services in the United States is 4.1%.