Zip Codes with the Highest Percentage of Households Without a Vehicle in Casa Grande, AZ
RELATED REPORTS & OPTIONS
Households without a Cars
Casa Grande
Compare Zip Codes
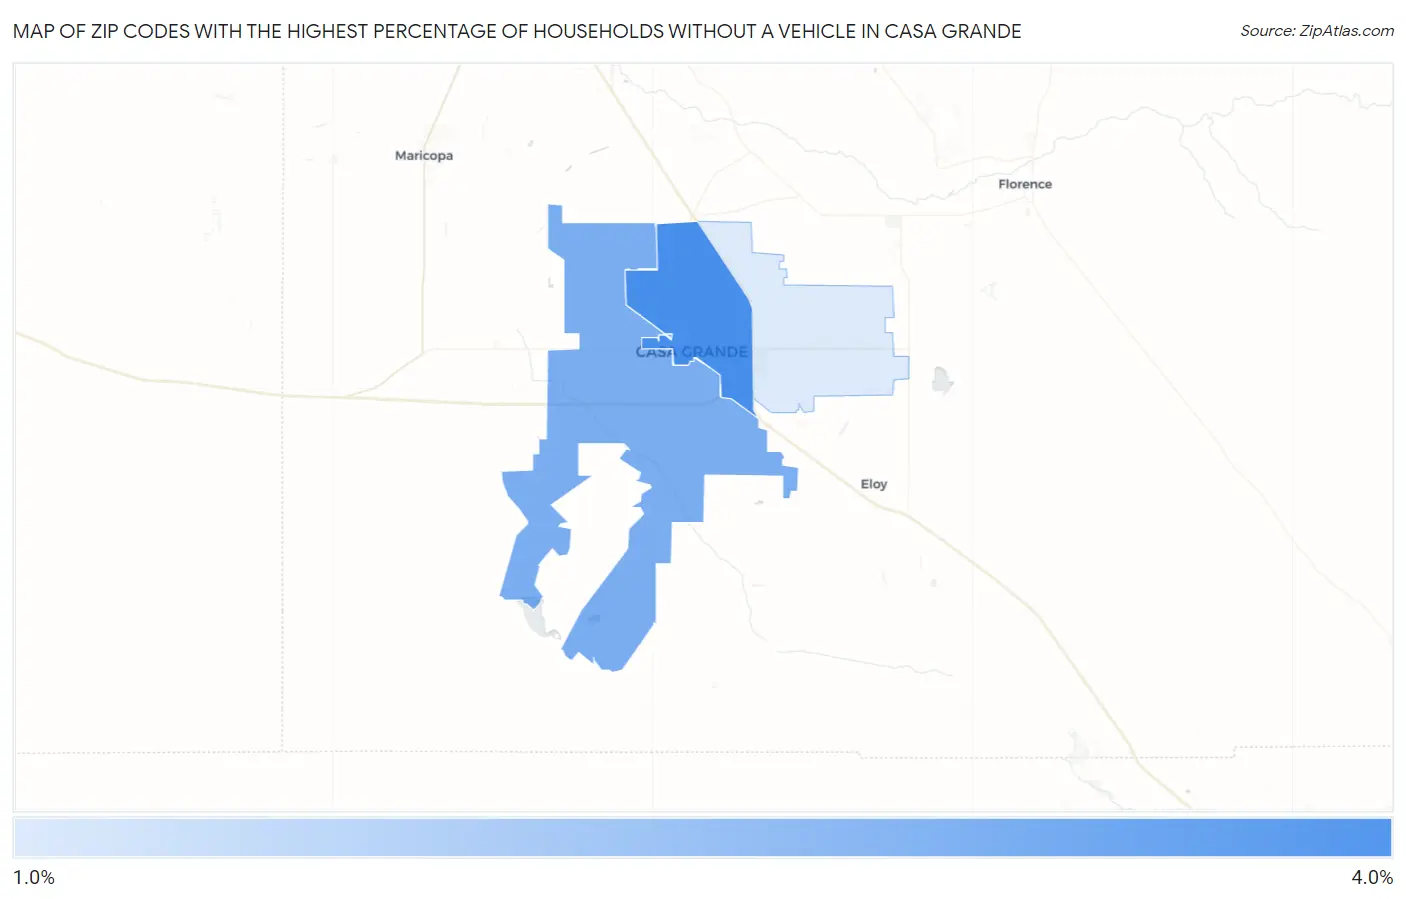
Map of Zip Codes with the Highest Percentage of Households Without a Vehicle in Casa Grande
1.6%
3.7%
Zip Codes with the Highest Percentage of Households Without a Vehicle in Casa Grande, AZ
| Zip Code | Housholds Without a Car | vs State | vs National | |
| 1. | 85122 | 3.7% | 5.5%(-1.80)#221 | 8.3%(-4.60)#16,629 |
| 2. | 85193 | 3.0% | 5.5%(-2.50)#248 | 8.3%(-5.30)#19,183 |
| 3. | 85194 | 1.6% | 5.5%(-3.90)#314 | 8.3%(-6.70)#23,838 |
1
Common Questions
What are the Top Zip Codes with the Highest Percentage of Households Without a Vehicle in Casa Grande, AZ?
Top Zip Codes with the Highest Percentage of Households Without a Vehicle in Casa Grande, AZ are:
What zip code has the Highest Percentage of Households Without a Vehicle in Casa Grande, AZ?
85122 has the Highest Percentage of Households Without a Vehicle in Casa Grande, AZ with 3.7%.
What is the Percentage of Households Without a Vehicle in Casa Grande, AZ?
Percentage of Households Without a Vehicle in Casa Grande is 2.9%.
What is the Percentage of Households Without a Vehicle in Arizona?
Percentage of Households Without a Vehicle in Arizona is 5.5%.
What is the Percentage of Households Without a Vehicle in the United States?
Percentage of Households Without a Vehicle in the United States is 8.3%.