Zip Codes with the Lowest Percentage of Renter-Occupied Units in Casa Grande, AZ
RELATED REPORTS & OPTIONS
Lowest Renter-Occupied
Casa Grande
Compare Zip Codes
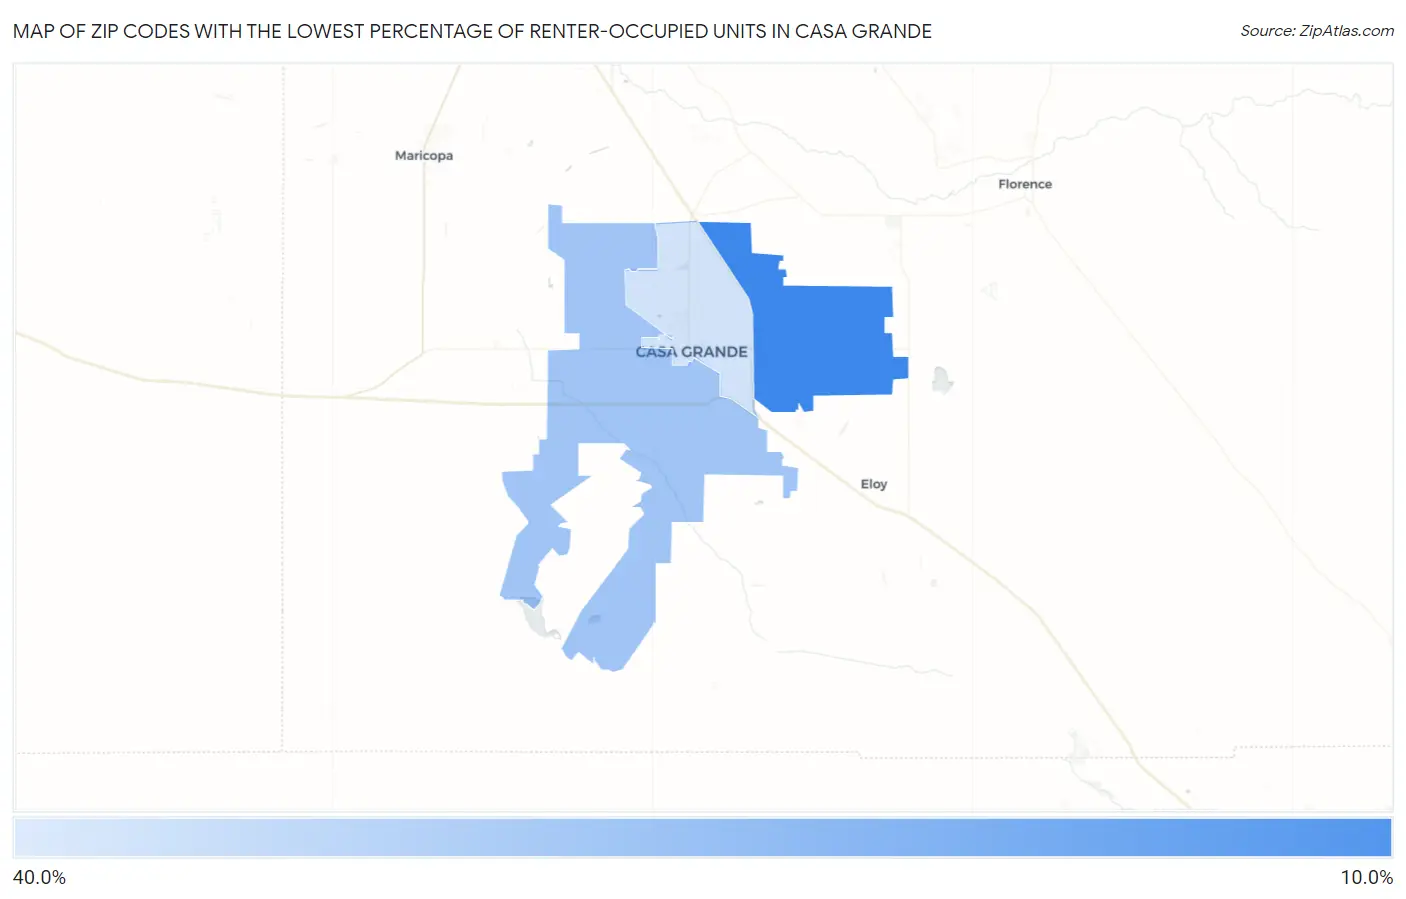
Map of Zip Codes with the Lowest Percentage of Renter-Occupied Units in Casa Grande
31.8%
10.2%
Zip Codes with the Lowest Percentage of Renter-Occupied Units in Casa Grande, AZ
| Zip Code | % Renter-Occupied | vs State | vs National | |
| 1. | 85194 | 10.2% | 33.7%(-23.5)#46 | 35.2%(-25.0)#3,927 |
| 2. | 85193 | 24.3% | 33.7%(-9.47)#183 | 35.2%(-10.9)#16,813 |
| 3. | 85122 | 31.8% | 33.7%(-1.88)#238 | 35.2%(-3.33)#22,166 |
1
Common Questions
What are the Top Zip Codes with the Lowest Percentage of Renter-Occupied Units in Casa Grande, AZ?
Top Zip Codes with the Lowest Percentage of Renter-Occupied Units in Casa Grande, AZ are:
What zip code has the Lowest Percentage of Renter-Occupied Units in Casa Grande, AZ?
85194 has the Lowest Percentage of Renter-Occupied Units in Casa Grande, AZ with 10.2%.
What is the Percentage of Renter-Occupied Units in Casa Grande, AZ?
Percentage of Renter-Occupied Units in Casa Grande is 30.2%.
What is the Percentage of Renter-Occupied Units in Arizona?
Percentage of Renter-Occupied Units in Arizona is 33.7%.
What is the Percentage of Renter-Occupied Units in the United States?
Percentage of Renter-Occupied Units in the United States is 35.2%.