Zip Codes with the Highest Percentage of White / Caucasian Population in Little Rock, AR

RELATED REPORTS & OPTIONS

White / Caucasian
Population
Families and Households
Female Fertility
Female Fertility (Unmarried)
Race (Community Size)
Race (Percentage)
Ancestry (Community Size)
AfricanAmericanApacheArabArgentineanArmenianAssyrian / Chaldean / SyriacAustrianBelgianBhutaneseBlackfeetBritishBurmeseCajunCanadianCelticCentral AmericanCherokeeChileanChoctawColombianCroatianCubanCzechCzechoslovakianDanishDutchEastern EuropeanEgyptianEnglishEuropeanFinnishFrenchFrench CanadianGermanGhanaianGreekGuatemalanGuyaneseHonduranHungarianIndian (Asian)InupiatIranianIrishIroquoisIsraeliItalianJamaicanKoreanLaotianLebaneseLithuanianMalaysianMexicanMexican American IndianMoroccanNative HawaiianNicaraguanNigerianNorthern EuropeanNorwegianOsagePakistaniPanamanianPolishPortuguesePuerto RicanRomanianRussianSalvadoranScandinavianScotch-IrishScottishSiouxSlavicSlovakSouth AmericanSpaniardSpanishSri LankanSubsaharan AfricanSwedishSwissSyrianThaiTrinidadian and TobagonianTurkishUkrainianVenezuelanVietnameseWelshWest IndianYugoslavian
Ancestry (Percentage)
AfricanAmericanApacheArabArgentineanArmenianAssyrian / Chaldean / SyriacAustrianBelgianBhutaneseBlackfeetBritishBurmeseCajunCanadianCelticCentral AmericanCherokeeChileanChoctawColombianCroatianCubanCzechCzechoslovakianDanishDutchEastern EuropeanEgyptianEnglishEuropeanFinnishFrenchFrench CanadianGermanGhanaianGreekGuatemalanGuyaneseHonduranHungarianIndian (Asian)InupiatIranianIrishIroquoisIsraeliItalianJamaicanKoreanLaotianLebaneseLithuanianMalaysianMexicanMexican American IndianMoroccanNative HawaiianNicaraguanNigerianNorthern EuropeanNorwegianOsagePakistaniPanamanianPolishPortuguesePuerto RicanRomanianRussianSalvadoranScandinavianScotch-IrishScottishSiouxSlavicSlovakSouth AmericanSpaniardSpanishSri LankanSubsaharan AfricanSwedishSwissSyrianThaiTrinidadian and TobagonianTurkishUkrainianVenezuelanVietnameseWelshWest IndianYugoslavian
Immigrant Origin (Total)
Immigrant Origin (Percentage)
Income
Income (Families)
Income (Households)
Poverty
Poverty (Families)
Unemployment
Employment Occupations
Employment Industries
Employer Class
Commute Time
Commute Means
School Enrollment
Education by Degree Field
Occupancy
Finances
Physical Characteristics
Little Rock
Compare Zip Codes
Comparison Subject

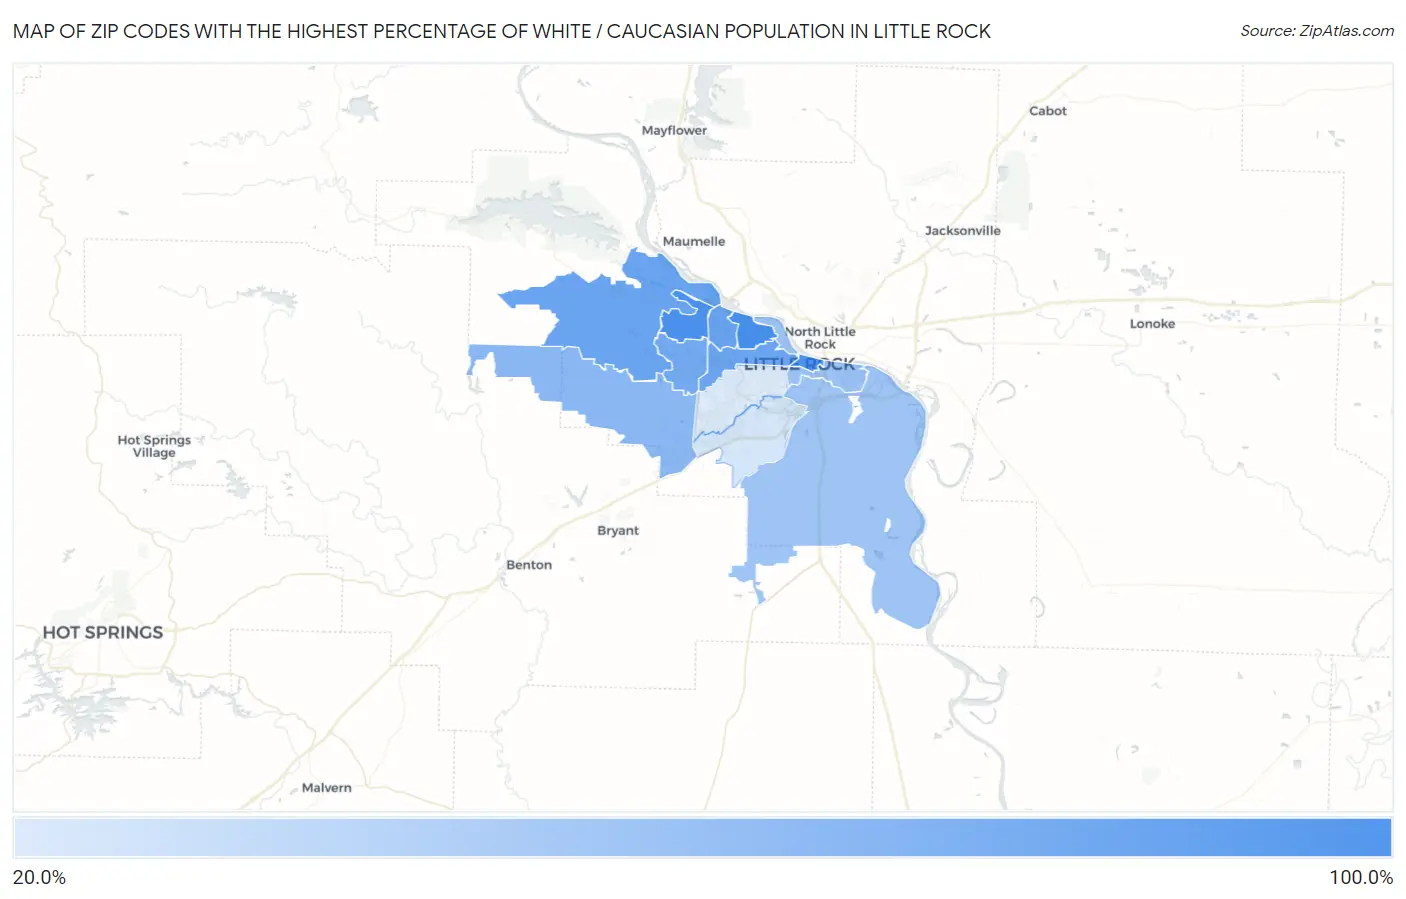
Map of Zip Codes with the Highest Percentage of White / Caucasian Population in Little Rock

0.0%
100.0%
Zip Codes with the Highest Percentage of White / Caucasian Population in Little Rock Map

Zip Codes with the Highest Percentage of White / Caucasian Population in Little Rock, AR

Zip Code White / Caucasian vs State vs National
1.7220783.3%72.7%(+10.6)#35265.9%(+17.4)#19,334
2.7221282.2%72.7%(+9.56)#36365.9%(+16.3)#19,903
3.7220179.4%72.7%(+6.74)#38565.9%(+13.5)#21,258
4.7222366.7%72.7%(-5.98)#46265.9%(+0.805)#25,660
5.7222766.3%72.7%(-6.33)#46565.9%(+0.449)#25,760
6.7220565.8%72.7%(-6.82)#46765.9%(-0.035)#25,883
7.7221162.2%72.7%(-10.4)#48765.9%(-3.65)#26,779
8.7221051.9%72.7%(-20.7)#52665.9%(-14.0)#28,856
9.7220245.4%72.7%(-27.2)#53865.9%(-20.5)#29,853
10.7220643.8%72.7%(-28.9)#54765.9%(-22.1)#30,077
11.7220922.8%72.7%(-49.8)#58465.9%(-43.0)#31,967
12.7220420.6%72.7%(-52.1)#58665.9%(-45.3)#32,098

Common Questions

What are the Top 10 Zip Codes with the Highest Percentage of White / Caucasian Population in Little Rock, AR?
Top 10 Zip Codes with the Highest Percentage of White / Caucasian Population in Little Rock, AR are:
#1
83.3%
#2
82.2%
#3
79.4%
#4
66.7%
#5
66.3%
#6
65.8%
#7
62.2%
#8
51.9%
#9
45.4%
#10
43.8%
What zip code has the Highest Percentage of White / Caucasian Population in Little Rock, AR?
72207 has the Highest Percentage of White / Caucasian Population in Little Rock, AR with 83.3%.
What is the Percentage of White / Caucasian Population in Little Rock, AR?
Percentage of White / Caucasian Population in Little Rock is 47.8%.
What is the Percentage of White / Caucasian Population in Arkansas?
Percentage of White / Caucasian Population in Arkansas is 72.7%.
What is the Percentage of White / Caucasian Population in the United States?
Percentage of White / Caucasian Population in the United States is 65.9%.