Zip Codes with the Highest Percentage of Immigrants from Romania in Encino, CA
On this page
RELATED REPORTS & OPTIONS
Romania
Population
Highest PopulationHighest Population DensityLowest Population DensityMale / Female RatioFemale / Male RatioOldest PopulationOldest Population | MaleOldest Population | FemaleYoungest PopulationYoungest Population | MaleYoungest Population | Female
Families and Households
Largest Family SizeLargest Household SizeMost Single FathersMost Single MothersFewest Single FathersFewest Single MothersSmallest Family SizeSmallest Household Size
Female Fertility
Highest Birth Rate | All WomenHighest Birth Rate | Women 35+Highest Birth Rate | Below PovertyHighest Birth Rate | Public IncomeHighest Birth Rate | In Labor ForceLowest Birth Rate | All WomenLowest Birth Rate | Women 35+Lowest Birth Rate | Below PovertyLowest Birth Rate | Public IncomeLowest Birth Rate | In Labor Force
Race (Community Size)
Race (Percentage)
Ancestry (Community Size)
AmericanArabArmenianAssyrian / Chaldean / SyriacAustrianBelgianBhutaneseBritishBurmeseCanadianCentral AmericanCherokeeChileanColombianCroatianCubanCzechoslovakianDanishDutchEastern EuropeanEcuadorianEgyptianEnglishEuropeanFinnishFrenchGermanGreekGuatemalanHungarianIndian (Asian)IranianIrishIsraeliItalianKoreanLatvianLebaneseLithuanianMexicanNorthern EuropeanNorwegianPakistaniPeruvianPolishPortuguesePuerto RicanRomanianRussianSalvadoranScotch-IrishScottishSerbianSouth AmericanSpaniardSri LankanSubsaharan AfricanSwedishSwissThaiTurkishUkrainianWelshYugoslavian
Ancestry (Percentage)
AmericanArabArmenianAssyrian / Chaldean / SyriacAustrianBelgianBhutaneseBritishBurmeseCanadianCentral AmericanCherokeeChileanColombianCroatianCubanCzechoslovakianDanishDutchEastern EuropeanEcuadorianEgyptianEnglishEuropeanFinnishFrenchGermanGreekGuatemalanHungarianIndian (Asian)IranianIrishIsraeliItalianKoreanLatvianLebaneseLithuanianMexicanNorthern EuropeanNorwegianPakistaniPeruvianPolishPortuguesePuerto RicanRomanianRussianSalvadoranScotch-IrishScottishSerbianSouth AmericanSpaniardSri LankanSubsaharan AfricanSwedishSwissThaiTurkishUkrainianWelshYugoslavian
Immigrant Origin (Total)
AfricaArgentinaAsiaBelarusCanadaCentral AmericaChileChinaColombiaEastern AfricaEastern AsiaEastern EuropeEcuadorEl SalvadorEnglandEuropeGermanyGuatemalaHong KongHungaryIndiaIranIraqIsraelItalyJapanKoreaLatin AmericaLebanonMexicoMoroccoNorthern AfricaNorthern EuropeNorwayOceaniaPhilippinesRomaniaSouth AfricaSouth AmericaSouth Central AsiaSouth Eastern AsiaSouthern EuropeSri LankaSwitzerlandTaiwanThailandTurkeyUkraineWestern AsiaWestern EuropeZimbabwe
Immigrant Origin (Percentage)
AfricaArgentinaAsiaBelarusCanadaCentral AmericaChileChinaColombiaEastern AfricaEastern AsiaEastern EuropeEcuadorEl SalvadorEnglandEuropeGermanyGuatemalaHong KongHungaryIndiaIranIraqIsraelItalyJapanKoreaLatin AmericaLebanonMexicoMoroccoNorthern AfricaNorthern EuropeNorwayOceaniaPhilippinesRomaniaSouth AfricaSouth AmericaSouth Central AsiaSouth Eastern AsiaSouthern EuropeSri LankaSwitzerlandTaiwanThailandTurkeyUkraineWestern AsiaWestern EuropeZimbabwe
Income
Highest Per Capita IncomeHighest Earnings | MaleHighest Earnings | FemaleHighest Wage/Income Gap ($)Highest Wage/Income Gap (%)Highest Inequality / Gini IndexLowest Per Capita IncomeLowest Earnings | MaleLowest Earnings | FemaleLowest Wage/Income Gap ($)Lowest Wage/Income Gap (%)Lowest Inequality / Gini Index
Income (Families)
Highest Family IncomeLowest Family IncomeFamily Income | $0-10kFamily Income | $100k+Family Income | $200k+
Income (Households)
Highest Household IncomeLowest Household IncomeHousehold Income | $0-10kHousehold Income | $200k+Household Income | $100k+
Poverty
Highest PovertyHighest Poverty | MaleHighest Poverty | FemaleHighest Poverty | Female 25-34Highest Poverty | Child 0-16Highest Poverty | Girls 0-16Highest Poverty | Seniors 65+Highest Poverty | Seniors 75+ Lowest PovertyLowest Poverty | MaleLowest Poverty | FemaleLowest Poverty | Child 0-16Lowest Poverty | Girls 0-16Lowest Poverty | Seniors 65+Lowest Poverty | Seniors 75+
Poverty (Families)
Highest Family PovertyHighest Poverty | Married CoupleHighest Poverty | Single FemaleHighest Poverty | Single MotherLowest Family PovertyLowest Poverty | Married CoupleLowest Poverty | Single FemaleLowest Poverty | Single Mother
Unemployment
Highest UnemploymentHighest Unemployment | MaleHighest Unemployment | FemaleHighest Unemployment | Youth < 25Highest Unemployment | Senior > 65Lowest UnemploymentLowest Unemployment | MaleLowest Unemployment | FemaleLowest Unemployment | Youth < 25Lowest Unemployment | Senior > 65
Employment Occupations
Architecture & EngineeringArts, Media & EntertainmentBusiness & FinancialCleaning & MaintenanceCommunity & Social Service Computer & MathematicsComputer, Engineering & ScienceConstruction & ExtractionEducation Instruction & LibraryEducation, Arts & MediaFirefighting & PreventionFood Preparation & ServingHealth Diagnosing & TreatingHealth TechnologistsHealthcare SupportInstallation, Maintenance & RepairLegal Services & SupportLife, Physical & Social ScienceManagementMaterial MovingOffice & AdministrationPersonal Care and ServiceProductionSales & RelatedSecurity & ProtectionTransportation
Employment Industries
Accommodation & Food ServicesAdministrative & Support ServicesAgriculture, Fishing & HuntingArts, Entertainment & RecreationConstructionEducational ServicesFinance & InsuranceHealth Care & Social AssistanceInformation & TechnologyManufacturingProfessional & Scientific ServicesPublic AdministrationReal Estate, Rental & LeasingRetail TradeTransportation & WarehousingWholesale Trade
Employer Class
Private Company EmployeesSelf-Employed / IncorporatedSelf-Employed / Not IncorporatedNot-for-profit OrganizationsLocal Government EmployeesState Government Employees
Commute Time
Longest CommuteLongest Commute | MaleLongest Commute | FemaleShortest CommuteShortest Commute | MaleShortest Commute | Female
Commute Means
School Enrollment
In Private SchoolNursery / PreschoolKindergartenElementary SchoolMiddle SchoolHigh SchoolCollegeUniversity
Education by Degree Field
Computers and MathematicsBio, Nature & AgriculturalPhysical and Health SciencesPsychologySocial SciencesEngineeringMultidisciplinary StudiesScience and EngineeringBusinessEducationLiterature and LanguagesLiberal Arts and HistoryVisual and Performing ArtsCommunicationsArts and Humanities
Occupancy
Finances
Highest Median Housing CostsHighest Property PricesHighest Owner Housing CostsHighest Renter Housing CostsHighest Housing Costs / IncomeLowest Median Housing CostsLowest Property PricesLowest Owner Housing CostsLowest Renter Housing CostsLowest Housing Costs / Income
Physical Characteristics
Encino
States
AlabamaAlaskaArizonaArkansasCaliforniaColoradoConnecticutDelawareDistrict Of ColumbiaFloridaGeorgiaHawaiiIdahoIllinoisIndianaIowaKansasKentuckyLouisianaMaineMarylandMassachusettsMichiganMinnesotaMississippiMissouriMontanaNebraskaNevadaNew HampshireNew JerseyNew MexicoNew YorkNorth CarolinaNorth DakotaOhioOklahomaOregonPennsylvaniaPuerto RicoRhode IslandSouth CarolinaSouth DakotaTennesseeTexasUtahVermontVirginiaWashingtonWest VirginiaWisconsinWyoming
California Cities
AnaheimAntiochArcadiaBakersfieldBerkeleyBuena ParkBurbankCanoga ParkCastro ValleyChicoChinoCitrus HeightsConcordCoronaCosta MesaDesert Hot SpringsDowneyElk GroveEncinoFremontFresnoFullertonGarden GroveGlendaleGlendoraHaywardHemetHuntington BeachIrvineLa MesaLakewoodLivermoreLong BeachLos AltosLos AngelesLos GatosMission ViejoModestoMoreno ValleyMountain ViewNorth HollywoodNorthridgeOaklandOceansideOrangeOxnardPalm SpringsPalmdalePalo AltoPasadenaPomonaRancho CucamongaReddingRedlandsRedwood CityRiversideRocklinRosevilleSacramentoSan BernardinoSan ClementeSan DiegoSan FranciscoSan JoseSan LeandroSan MarcosSan MateoSan PedroSan RafaelSan RamonSanta CruzSanta MariaSanta MonicaSanta RosaSherman OaksSimi ValleyStocktonSunnyvaleThousand OaksTorranceVan NuysVenturaVisaliaWhittierWoodland HillsYorba LindaYuba City
Compare Zip Codes
Comparison Subject
Compare StatesCompare CitiesCompare Zip Codes
Map of Zip Codes with the Highest Percentage of Immigrants from Romania in Encino
0.20%
0.34%
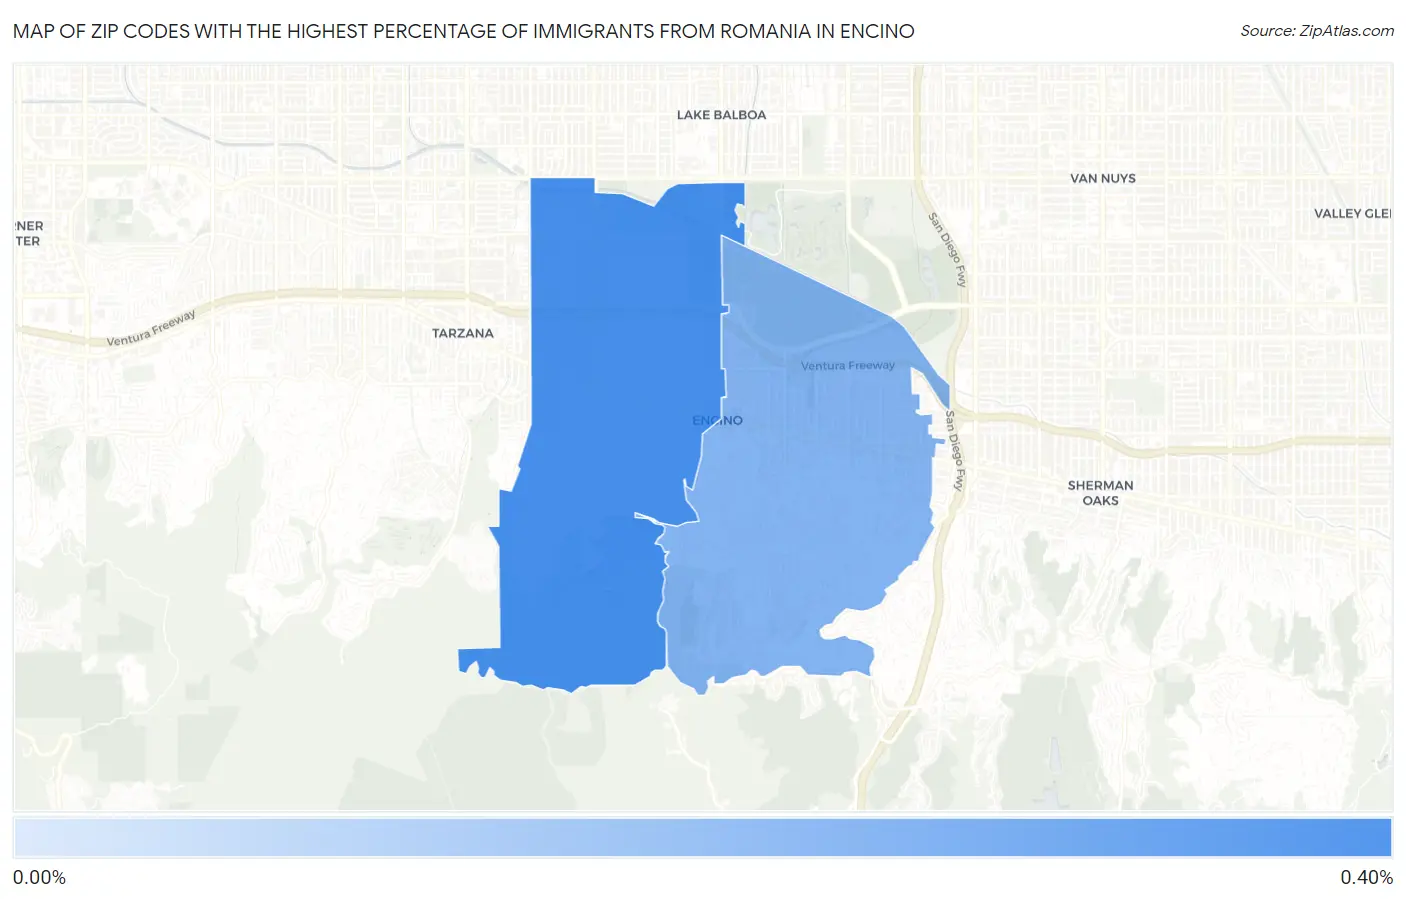
Zip Codes with the Highest Percentage of Immigrants from Romania in Encino, CA
| Zip Code | Romania | vs State | vs National | |
| 1. | 91316 | 0.34% | 0.059%(+0.278)#46 | 0.050%(+0.287)#571 |
| 2. | 91436 | 0.20% | 0.059%(+0.145)#110 | 0.050%(+0.154)#1,042 |
1
Common Questions
What are the Top Zip Codes with the Highest Percentage of Immigrants from Romania in Encino, CA?
Top Zip Codes with the Highest Percentage of Immigrants from Romania in Encino, CA are:
What zip code has the Highest Percentage of Immigrants from Romania in Encino, CA?
91316 has the Highest Percentage of Immigrants from Romania in Encino, CA with 0.34%.
What is the Percentage of Immigrants from Romania in California?
Percentage of Immigrants from Romania in California is 0.059%.
What is the Percentage of Immigrants from Romania in the United States?
Percentage of Immigrants from Romania in the United States is 0.050%.