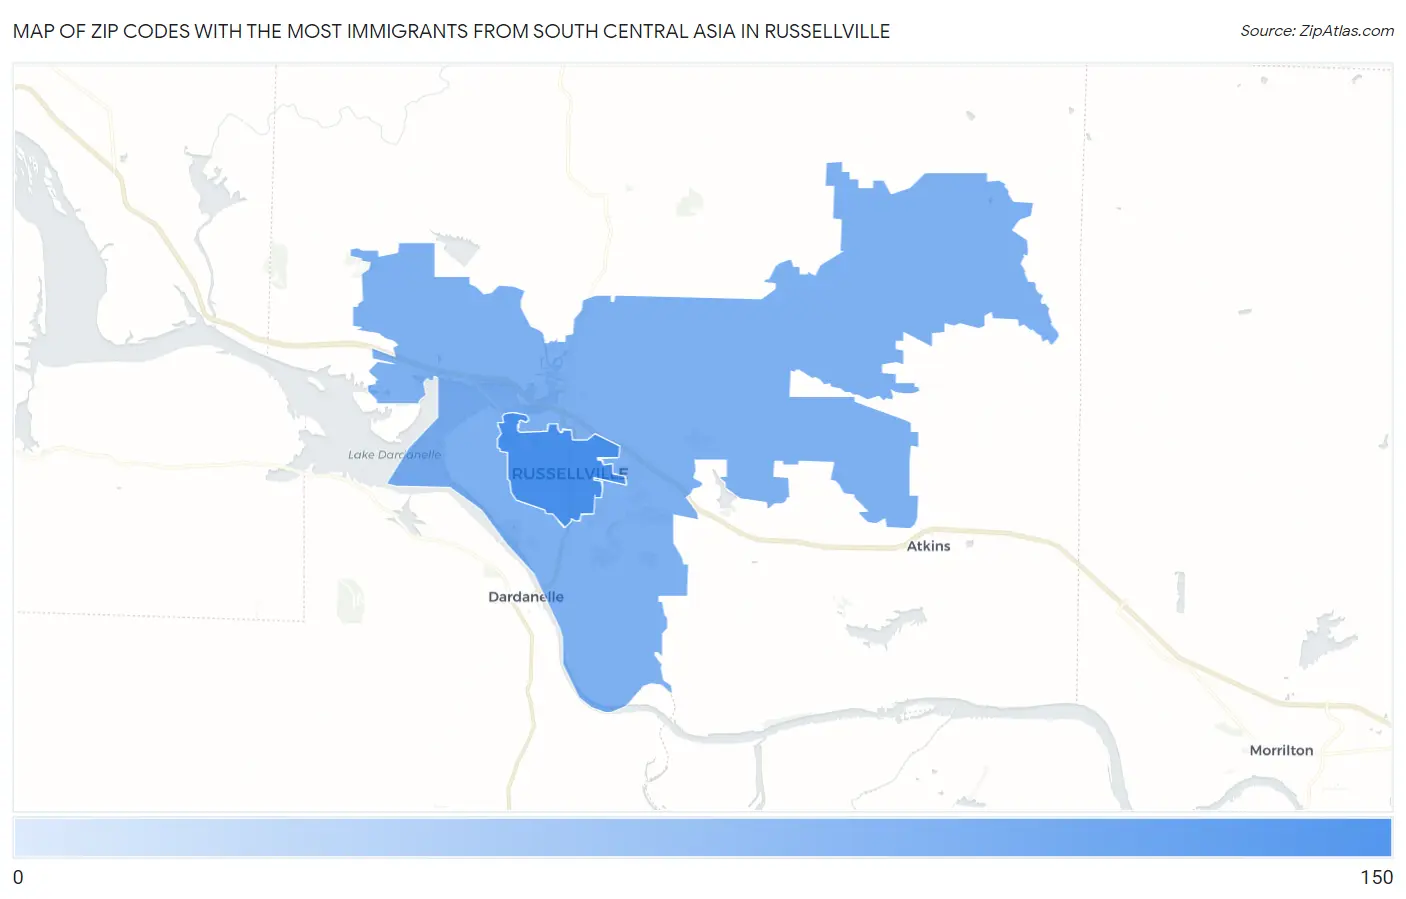
Zip Codes with the Most Immigrants from South Central Asia in Russellville, AR
RELATED REPORTS & OPTIONS
South Central Asia
Russellville
Compare Zip Codes
Map of Zip Codes with the Most Immigrants from South Central Asia in Russellville
24
149
Zip Codes with the Most Immigrants from South Central Asia in Russellville, AR
| Zip Code | South Central Asia | vs State | vs National | |
| 1. | 72801 | 149 | 11,995(1.24%)#17 | 4,330,976(0.00%)#4,486 |
| 2. | 72802 | 24 | 11,995(0.20%)#49 | 4,330,976(0.00%)#8,228 |
1
Common Questions
What are the Top Zip Codes with the Most Immigrants from South Central Asia in Russellville, AR?
Top Zip Codes with the Most Immigrants from South Central Asia in Russellville, AR are:
What zip code has the Most Immigrants from South Central Asia in Russellville, AR?
72801 has the Most Immigrants from South Central Asia in Russellville, AR with 149.
What is the Total Immigrants from South Central Asia in Russellville, AR?
Total Immigrants from South Central Asia in Russellville is 173.
What is the Total Immigrants from South Central Asia in Arkansas?
Total Immigrants from South Central Asia in Arkansas is 11,995.
What is the Total Immigrants from South Central Asia in the United States?
Total Immigrants from South Central Asia in the United States is 4,330,976.