Zip Codes with the Most Immigrants from South Eastern Asia in Pine Bluff, AR
RELATED REPORTS & OPTIONS
South Eastern Asia
Pine Bluff
Compare Zip Codes
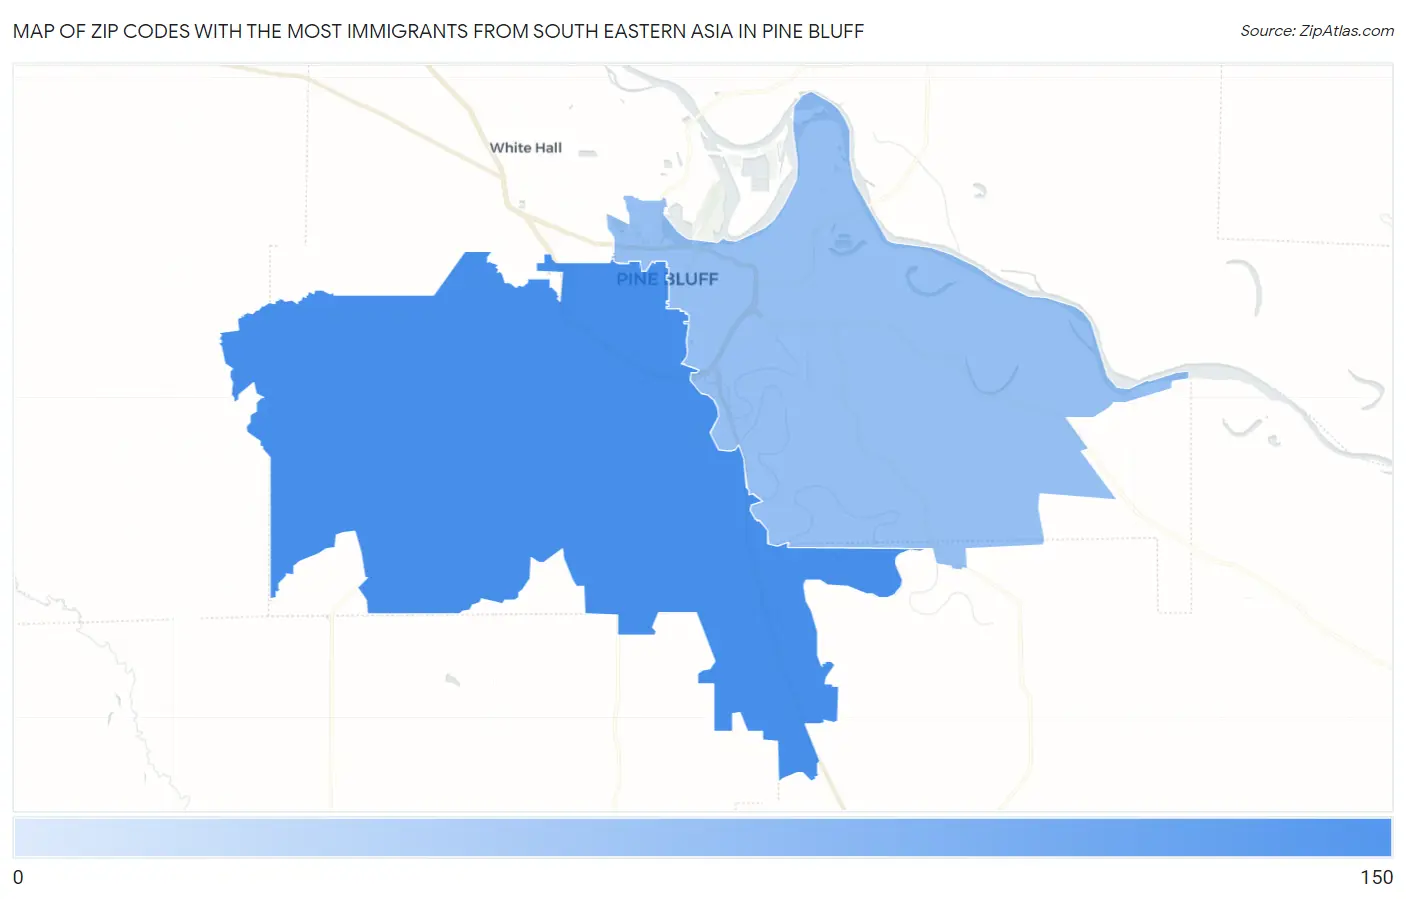
Map of Zip Codes with the Most Immigrants from South Eastern Asia in Pine Bluff
9
130
Zip Codes with the Most Immigrants from South Eastern Asia in Pine Bluff, AR
| Zip Code | South Eastern Asia | vs State | vs National | |
| 1. | 71603 | 130 | 13,973(0.93%)#31 | 4,292,058(0.00%)#5,206 |
| 2. | 71601 | 9 | 13,973(0.06%)#110 | 4,292,058(0.00%)#12,081 |
1
Common Questions
What are the Top Zip Codes with the Most Immigrants from South Eastern Asia in Pine Bluff, AR?
Top Zip Codes with the Most Immigrants from South Eastern Asia in Pine Bluff, AR are:
What zip code has the Most Immigrants from South Eastern Asia in Pine Bluff, AR?
71603 has the Most Immigrants from South Eastern Asia in Pine Bluff, AR with 130.
What is the Total Immigrants from South Eastern Asia in Pine Bluff, AR?
Total Immigrants from South Eastern Asia in Pine Bluff is 126.
What is the Total Immigrants from South Eastern Asia in Arkansas?
Total Immigrants from South Eastern Asia in Arkansas is 13,973.
What is the Total Immigrants from South Eastern Asia in the United States?
Total Immigrants from South Eastern Asia in the United States is 4,292,058.