Zip Codes with the Highest Percentage of Population Employed in Security & Protection in Janesville, WI
RELATED REPORTS & OPTIONS
Security & Protection
Janesville
Compare Zip Codes
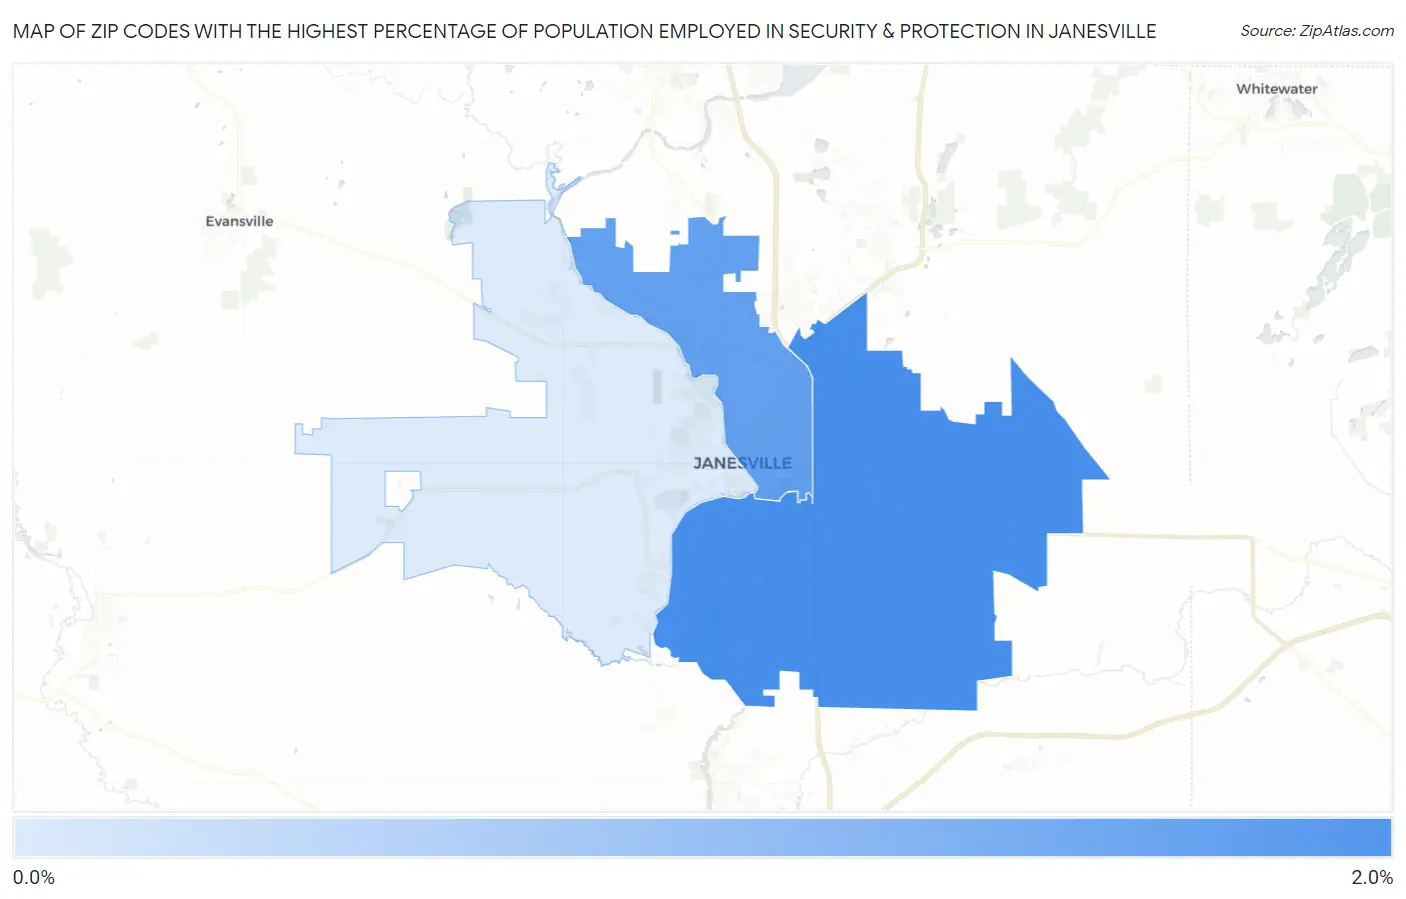
Map of Zip Codes with the Highest Percentage of Population Employed in Security & Protection in Janesville
0.79%
1.8%
Zip Codes with the Highest Percentage of Population Employed in Security & Protection in Janesville, WI
| Zip Code | % Employed | vs State | vs National | |
| 1. | 53546 | 1.8% | 1.6%(+0.181)#233 | 2.1%(-0.333)#13,817 |
| 2. | 53545 | 1.6% | 1.6%(-0.007)#274 | 2.1%(-0.521)#15,198 |
| 3. | 53548 | 0.79% | 1.6%(-0.847)#532 | 2.1%(-1.36)#21,478 |
1
Common Questions
What are the Top Zip Codes with the Highest Percentage of Population Employed in Security & Protection in Janesville, WI?
Top Zip Codes with the Highest Percentage of Population Employed in Security & Protection in Janesville, WI are:
What zip code has the Highest Percentage of Population Employed in Security & Protection in Janesville, WI?
53546 has the Highest Percentage of Population Employed in Security & Protection in Janesville, WI with 1.8%.
What is the Percentage of Population Employed in Security & Protection in Janesville, WI?
Percentage of Population Employed in Security & Protection in Janesville is 1.5%.
What is the Percentage of Population Employed in Security & Protection in Wisconsin?
Percentage of Population Employed in Security & Protection in Wisconsin is 1.6%.
What is the Percentage of Population Employed in Security & Protection in the United States?
Percentage of Population Employed in Security & Protection in the United States is 2.1%.