Sudanese vs Immigrants from Middle Africa 4 or more Vehicles in Household
COMPARE
Sudanese
Immigrants from Middle Africa
4 or more Vehicles in Household
4 or more Vehicles in Household Comparison
Sudanese
Immigrants from Middle Africa
5.6%
4 OR MORE VEHICLES IN HOUSEHOLD
1.2/ 100
METRIC RATING
261st/ 347
METRIC RANK
5.8%
4 OR MORE VEHICLES IN HOUSEHOLD
3.4/ 100
METRIC RATING
242nd/ 347
METRIC RANK
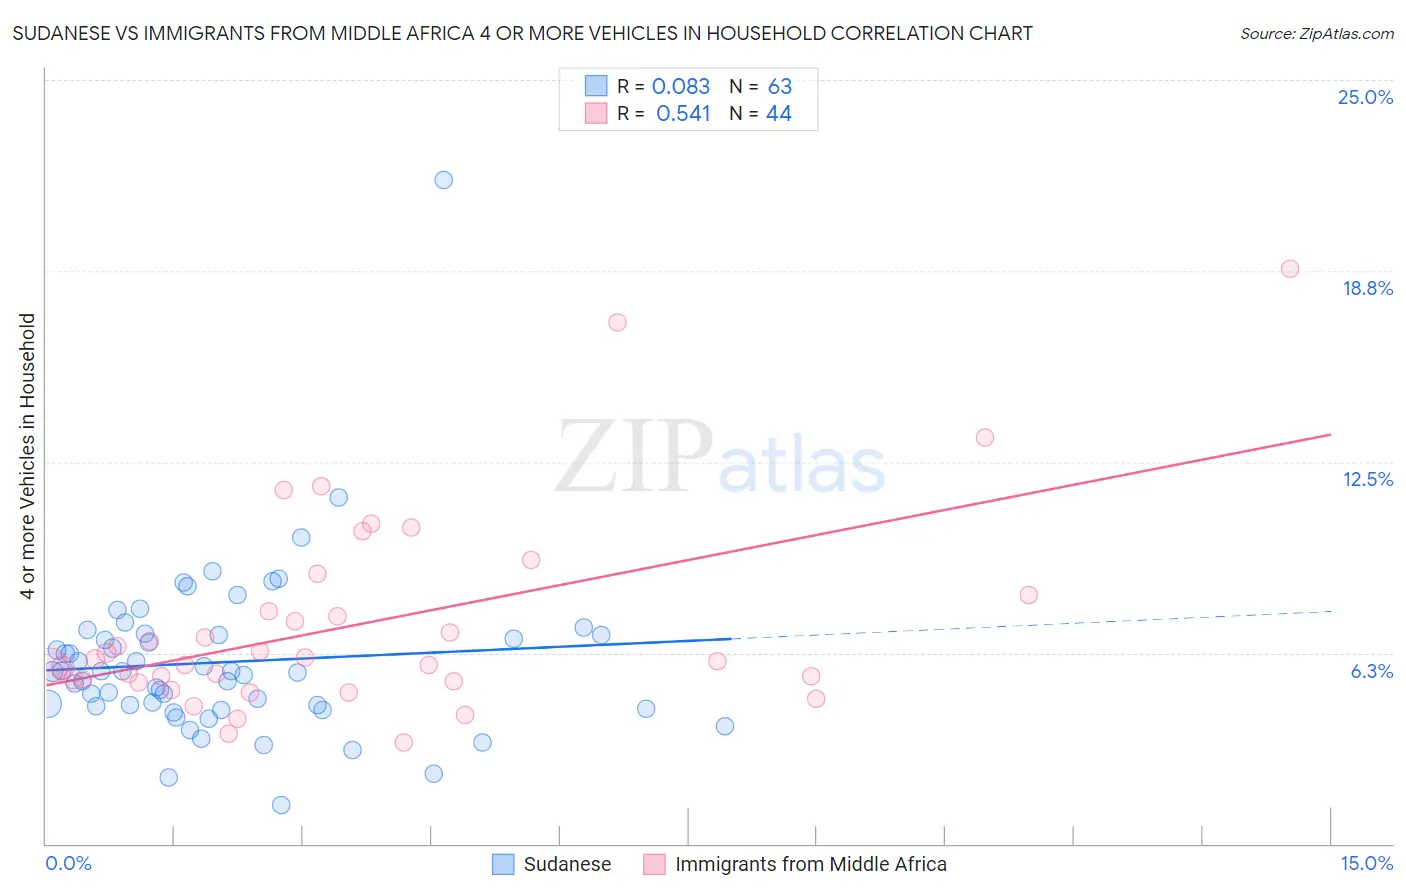
Sudanese vs Immigrants from Middle Africa 4 or more Vehicles in Household Correlation Chart
The statistical analysis conducted on geographies consisting of 109,909,032 people shows a slight positive correlation between the proportion of Sudanese and percentage of households with 4 or more vehicles available in the United States with a correlation coefficient (R) of 0.083 and weighted average of 5.6%. Similarly, the statistical analysis conducted on geographies consisting of 201,882,462 people shows a substantial positive correlation between the proportion of Immigrants from Middle Africa and percentage of households with 4 or more vehicles available in the United States with a correlation coefficient (R) of 0.541 and weighted average of 5.8%, a difference of 3.0%.
4 or more Vehicles in Household Correlation Summary
| Measurement | Sudanese | Immigrants from Middle Africa |
| Minimum | 1.3% | 3.3% |
| Maximum | 21.7% | 18.8% |
| Range | 20.5% | 15.5% |
| Mean | 5.9% | 7.2% |
| Median | 5.6% | 6.0% |
| Interquartile 25% (IQ1) | 4.5% | 5.3% |
| Interquartile 75% (IQ3) | 6.9% | 7.9% |
| Interquartile Range (IQR) | 2.3% | 2.5% |
| Standard Deviation (Sample) | 2.8% | 3.3% |
| Standard Deviation (Population) | 2.7% | 3.2% |
Demographics Similar to Sudanese and Immigrants from Middle Africa by 4 or more Vehicles in Household
In terms of 4 or more vehicles in household, the demographic groups most similar to Sudanese are Uruguayan (5.6%, a difference of 0.090%), Immigrants from France (5.6%, a difference of 0.27%), Immigrants from Lithuania (5.6%, a difference of 0.30%), Immigrants from Northern Africa (5.6%, a difference of 0.44%), and Immigrants from Turkey (5.7%, a difference of 0.52%). Similarly, the demographic groups most similar to Immigrants from Middle Africa are Immigrants from Czechoslovakia (5.8%, a difference of 0.19%), Ethiopian (5.8%, a difference of 0.20%), Mongolian (5.8%, a difference of 0.21%), Bulgarian (5.8%, a difference of 0.24%), and Immigrants from North Macedonia (5.7%, a difference of 0.91%).
| Demographics | Rating | Rank | 4 or more Vehicles in Household |
| Mongolians | 3.7 /100 | #241 | Tragic 5.8% |
| Immigrants | Middle Africa | 3.4 /100 | #242 | Tragic 5.8% |
| Immigrants | Czechoslovakia | 3.2 /100 | #243 | Tragic 5.8% |
| Ethiopians | 3.2 /100 | #244 | Tragic 5.8% |
| Bulgarians | 3.1 /100 | #245 | Tragic 5.8% |
| Immigrants | North Macedonia | 2.5 /100 | #246 | Tragic 5.7% |
| Immigrants | Ethiopia | 2.4 /100 | #247 | Tragic 5.7% |
| Immigrants | Eastern Africa | 2.4 /100 | #248 | Tragic 5.7% |
| Immigrants | Southern Europe | 2.3 /100 | #249 | Tragic 5.7% |
| Immigrants | Europe | 2.3 /100 | #250 | Tragic 5.7% |
| Ugandans | 2.2 /100 | #251 | Tragic 5.7% |
| Sub-Saharan Africans | 2.1 /100 | #252 | Tragic 5.7% |
| Immigrants | Cuba | 1.6 /100 | #253 | Tragic 5.7% |
| Immigrants | Panama | 1.5 /100 | #254 | Tragic 5.7% |
| Yup'ik | 1.5 /100 | #255 | Tragic 5.7% |
| Immigrants | Turkey | 1.5 /100 | #256 | Tragic 5.7% |
| Immigrants | Northern Africa | 1.4 /100 | #257 | Tragic 5.6% |
| Immigrants | Lithuania | 1.4 /100 | #258 | Tragic 5.6% |
| Immigrants | France | 1.3 /100 | #259 | Tragic 5.6% |
| Uruguayans | 1.3 /100 | #260 | Tragic 5.6% |
| Sudanese | 1.2 /100 | #261 | Tragic 5.6% |