Portuguese vs Chinese 4 or more Vehicles in Household
COMPARE
Portuguese
Chinese
4 or more Vehicles in Household
4 or more Vehicles in Household Comparison
Portuguese
Chinese
7.4%
4 OR MORE VEHICLES IN HOUSEHOLD
99.9/ 100
METRIC RATING
73rd/ 347
METRIC RANK
8.8%
4 OR MORE VEHICLES IN HOUSEHOLD
100.0/ 100
METRIC RATING
14th/ 347
METRIC RANK
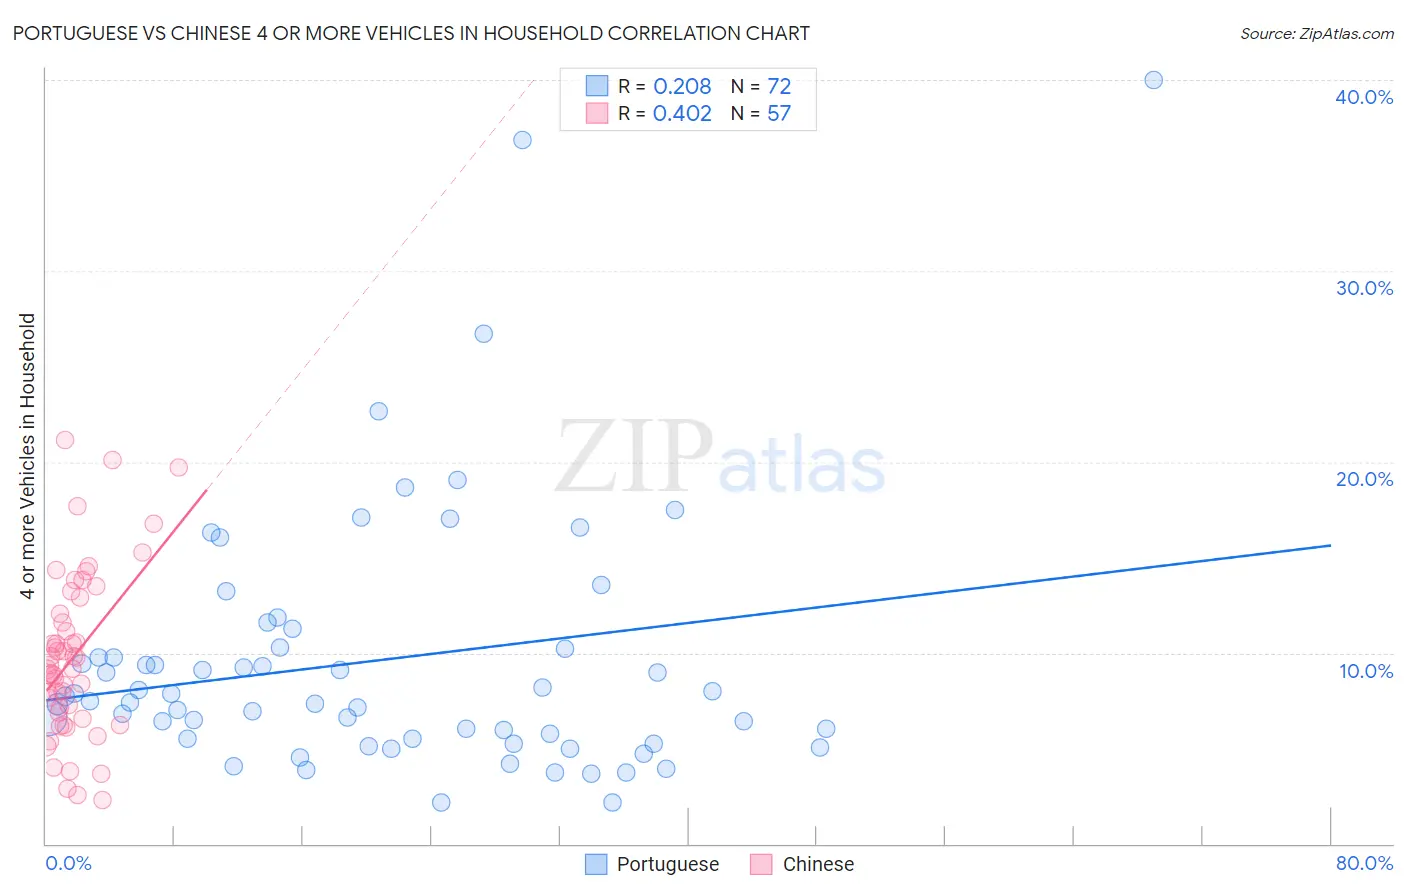
Portuguese vs Chinese 4 or more Vehicles in Household Correlation Chart
The statistical analysis conducted on geographies consisting of 448,080,831 people shows a weak positive correlation between the proportion of Portuguese and percentage of households with 4 or more vehicles available in the United States with a correlation coefficient (R) of 0.208 and weighted average of 7.4%. Similarly, the statistical analysis conducted on geographies consisting of 64,794,143 people shows a moderate positive correlation between the proportion of Chinese and percentage of households with 4 or more vehicles available in the United States with a correlation coefficient (R) of 0.402 and weighted average of 8.8%, a difference of 19.5%.
4 or more Vehicles in Household Correlation Summary
| Measurement | Portuguese | Chinese |
| Minimum | 2.1% | 2.3% |
| Maximum | 40.0% | 21.2% |
| Range | 37.9% | 18.9% |
| Mean | 9.6% | 9.8% |
| Median | 7.6% | 9.2% |
| Interquartile 25% (IQ1) | 5.5% | 6.7% |
| Interquartile 75% (IQ3) | 10.2% | 12.5% |
| Interquartile Range (IQR) | 4.8% | 5.8% |
| Standard Deviation (Sample) | 6.9% | 4.3% |
| Standard Deviation (Population) | 6.8% | 4.3% |
Similar Demographics by 4 or more Vehicles in Household
Demographics Similar to Portuguese by 4 or more Vehicles in Household
In terms of 4 or more vehicles in household, the demographic groups most similar to Portuguese are Scotch-Irish (7.4%, a difference of 0.090%), Icelander (7.4%, a difference of 0.30%), Immigrants from Cambodia (7.4%, a difference of 0.31%), Laotian (7.4%, a difference of 0.36%), and Chickasaw (7.4%, a difference of 0.39%).
| Demographics | Rating | Rank | 4 or more Vehicles in Household |
| Immigrants | Taiwan | 99.9 /100 | #66 | Exceptional 7.5% |
| Americans | 99.9 /100 | #67 | Exceptional 7.5% |
| Welsh | 99.9 /100 | #68 | Exceptional 7.5% |
| Germans | 99.9 /100 | #69 | Exceptional 7.5% |
| Scottish | 99.9 /100 | #70 | Exceptional 7.4% |
| Chickasaw | 99.9 /100 | #71 | Exceptional 7.4% |
| Scotch-Irish | 99.9 /100 | #72 | Exceptional 7.4% |
| Portuguese | 99.9 /100 | #73 | Exceptional 7.4% |
| Icelanders | 99.9 /100 | #74 | Exceptional 7.4% |
| Immigrants | Cambodia | 99.9 /100 | #75 | Exceptional 7.4% |
| Laotians | 99.9 /100 | #76 | Exceptional 7.4% |
| Apache | 99.9 /100 | #77 | Exceptional 7.4% |
| Whites/Caucasians | 99.8 /100 | #78 | Exceptional 7.4% |
| Czechs | 99.8 /100 | #79 | Exceptional 7.4% |
| Alaska Natives | 99.8 /100 | #80 | Exceptional 7.3% |
Demographics Similar to Chinese by 4 or more Vehicles in Household
In terms of 4 or more vehicles in household, the demographic groups most similar to Chinese are Shoshone (8.8%, a difference of 0.030%), Lumbee (8.8%, a difference of 0.74%), Hawaiian (8.9%, a difference of 1.0%), Mexican (8.9%, a difference of 1.0%), and Ute (8.8%, a difference of 1.1%).
| Demographics | Rating | Rank | 4 or more Vehicles in Household |
| Native Hawaiians | 100.0 /100 | #7 | Exceptional 9.4% |
| Arapaho | 100.0 /100 | #8 | Exceptional 9.4% |
| Samoans | 100.0 /100 | #9 | Exceptional 9.2% |
| Paiute | 100.0 /100 | #10 | Exceptional 9.0% |
| Immigrants | Mexico | 100.0 /100 | #11 | Exceptional 9.0% |
| Mexicans | 100.0 /100 | #12 | Exceptional 8.9% |
| Hawaiians | 100.0 /100 | #13 | Exceptional 8.9% |
| Chinese | 100.0 /100 | #14 | Exceptional 8.8% |
| Shoshone | 100.0 /100 | #15 | Exceptional 8.8% |
| Lumbee | 100.0 /100 | #16 | Exceptional 8.8% |
| Ute | 100.0 /100 | #17 | Exceptional 8.8% |
| Nepalese | 100.0 /100 | #18 | Exceptional 8.7% |
| Koreans | 100.0 /100 | #19 | Exceptional 8.6% |
| Pueblo | 100.0 /100 | #20 | Exceptional 8.6% |
| Danes | 100.0 /100 | #21 | Exceptional 8.6% |