Osage vs Immigrants from Northern Europe 4 or more Vehicles in Household
COMPARE
Osage
Immigrants from Northern Europe
4 or more Vehicles in Household
4 or more Vehicles in Household Comparison
Osage
Immigrants from Northern Europe
7.8%
4 OR MORE VEHICLES IN HOUSEHOLD
100.0/ 100
METRIC RATING
47th/ 347
METRIC RANK
6.2%
4 OR MORE VEHICLES IN HOUSEHOLD
36.8/ 100
METRIC RATING
186th/ 347
METRIC RANK
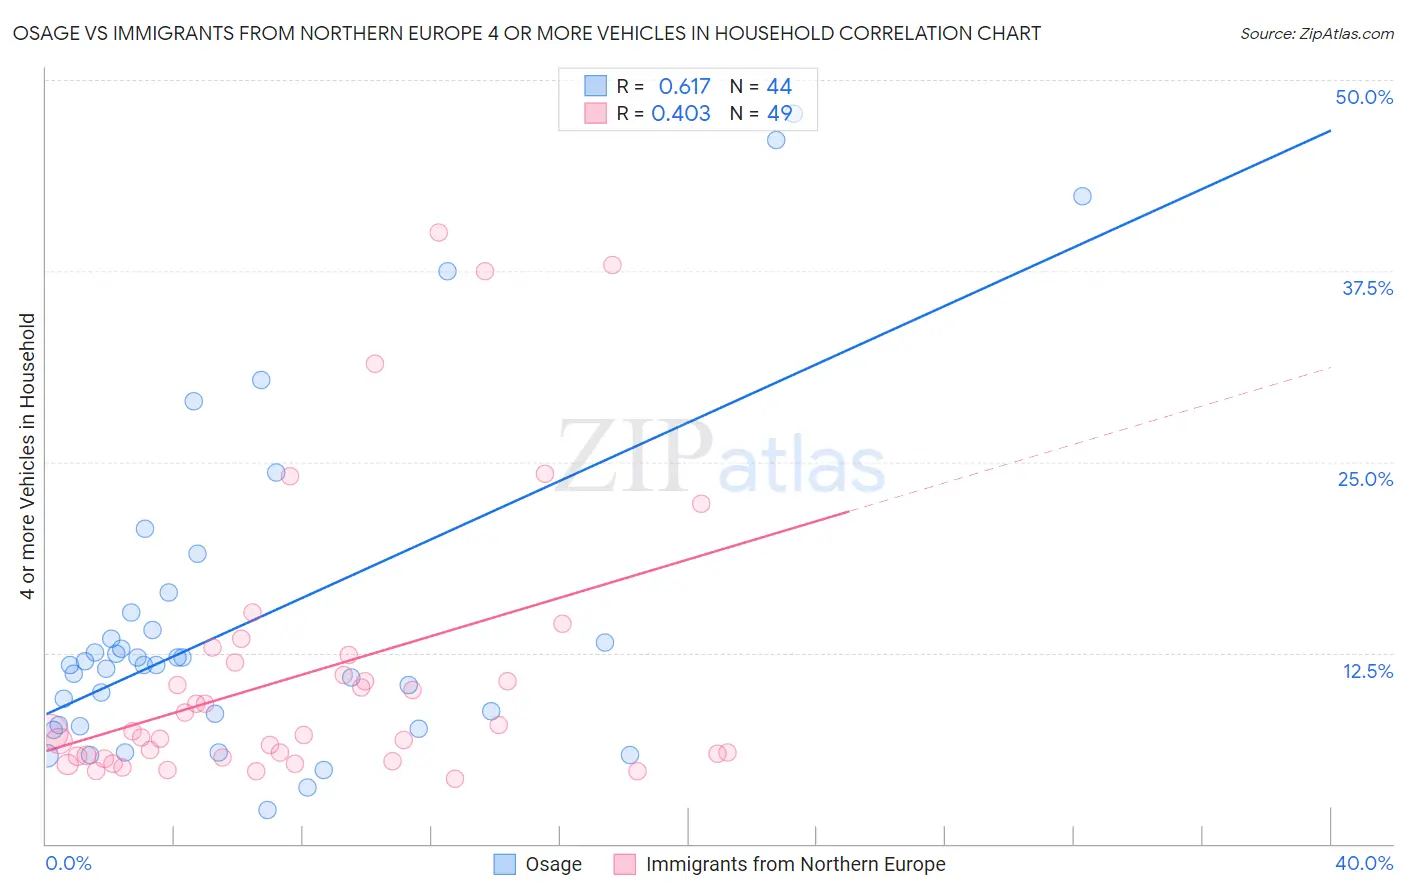
Osage vs Immigrants from Northern Europe 4 or more Vehicles in Household Correlation Chart
The statistical analysis conducted on geographies consisting of 91,747,496 people shows a significant positive correlation between the proportion of Osage and percentage of households with 4 or more vehicles available in the United States with a correlation coefficient (R) of 0.617 and weighted average of 7.8%. Similarly, the statistical analysis conducted on geographies consisting of 474,937,091 people shows a moderate positive correlation between the proportion of Immigrants from Northern Europe and percentage of households with 4 or more vehicles available in the United States with a correlation coefficient (R) of 0.403 and weighted average of 6.2%, a difference of 24.5%.
4 or more Vehicles in Household Correlation Summary
| Measurement | Osage | Immigrants from Northern Europe |
| Minimum | 2.2% | 4.3% |
| Maximum | 47.8% | 40.0% |
| Range | 45.7% | 35.7% |
| Mean | 14.6% | 11.2% |
| Median | 11.7% | 7.3% |
| Interquartile 25% (IQ1) | 7.7% | 5.7% |
| Interquartile 75% (IQ3) | 14.6% | 12.1% |
| Interquartile Range (IQR) | 6.8% | 6.4% |
| Standard Deviation (Sample) | 11.0% | 9.0% |
| Standard Deviation (Population) | 10.9% | 9.0% |
Similar Demographics by 4 or more Vehicles in Household
Demographics Similar to Osage by 4 or more Vehicles in Household
In terms of 4 or more vehicles in household, the demographic groups most similar to Osage are Crow (7.8%, a difference of 0.16%), Swiss (7.8%, a difference of 0.17%), Choctaw (7.8%, a difference of 0.33%), Cherokee (7.7%, a difference of 0.36%), and Bhutanese (7.8%, a difference of 0.38%).
| Demographics | Rating | Rank | 4 or more Vehicles in Household |
| Spanish | 100.0 /100 | #40 | Exceptional 7.9% |
| Pima | 100.0 /100 | #41 | Exceptional 7.9% |
| Salvadorans | 100.0 /100 | #42 | Exceptional 7.8% |
| Fijians | 100.0 /100 | #43 | Exceptional 7.8% |
| Bhutanese | 100.0 /100 | #44 | Exceptional 7.8% |
| Choctaw | 100.0 /100 | #45 | Exceptional 7.8% |
| Crow | 100.0 /100 | #46 | Exceptional 7.8% |
| Osage | 100.0 /100 | #47 | Exceptional 7.8% |
| Swiss | 100.0 /100 | #48 | Exceptional 7.8% |
| Cherokee | 100.0 /100 | #49 | Exceptional 7.7% |
| Immigrants | El Salvador | 100.0 /100 | #50 | Exceptional 7.7% |
| Immigrants | Laos | 100.0 /100 | #51 | Exceptional 7.7% |
| Japanese | 100.0 /100 | #52 | Exceptional 7.7% |
| Malaysians | 100.0 /100 | #53 | Exceptional 7.7% |
| Dutch | 100.0 /100 | #54 | Exceptional 7.7% |
Demographics Similar to Immigrants from Northern Europe by 4 or more Vehicles in Household
In terms of 4 or more vehicles in household, the demographic groups most similar to Immigrants from Northern Europe are Thai (6.2%, a difference of 0.020%), Iraqi (6.2%, a difference of 0.060%), Immigrants from Burma/Myanmar (6.2%, a difference of 0.080%), Immigrants from South Africa (6.2%, a difference of 0.15%), and Kiowa (6.2%, a difference of 0.23%).
| Demographics | Rating | Rank | 4 or more Vehicles in Household |
| Immigrants | Japan | 43.1 /100 | #179 | Average 6.3% |
| Syrians | 42.0 /100 | #180 | Average 6.3% |
| Yugoslavians | 41.1 /100 | #181 | Average 6.3% |
| South American Indians | 40.7 /100 | #182 | Average 6.3% |
| Immigrants | Burma/Myanmar | 37.5 /100 | #183 | Fair 6.2% |
| Iraqis | 37.3 /100 | #184 | Fair 6.2% |
| Thais | 36.9 /100 | #185 | Fair 6.2% |
| Immigrants | Northern Europe | 36.8 /100 | #186 | Fair 6.2% |
| Immigrants | South Africa | 35.4 /100 | #187 | Fair 6.2% |
| Kiowa | 34.7 /100 | #188 | Fair 6.2% |
| Immigrants | Eastern Asia | 33.3 /100 | #189 | Fair 6.2% |
| South Africans | 32.2 /100 | #190 | Fair 6.2% |
| Inupiat | 30.7 /100 | #191 | Fair 6.2% |
| Romanians | 30.7 /100 | #192 | Fair 6.2% |
| Immigrants | Kuwait | 28.0 /100 | #193 | Fair 6.2% |