Okinawan vs Immigrants from Sweden 3 or more Vehicles in Household
COMPARE
Okinawan
Immigrants from Sweden
3 or more Vehicles in Household
3 or more Vehicles in Household Comparison
Okinawans
Immigrants from Sweden
17.4%
3 OR MORE VEHICLES IN HOUSEHOLD
0.4/ 100
METRIC RATING
276th/ 347
METRIC RANK
19.2%
3 OR MORE VEHICLES IN HOUSEHOLD
29.0/ 100
METRIC RATING
186th/ 347
METRIC RANK
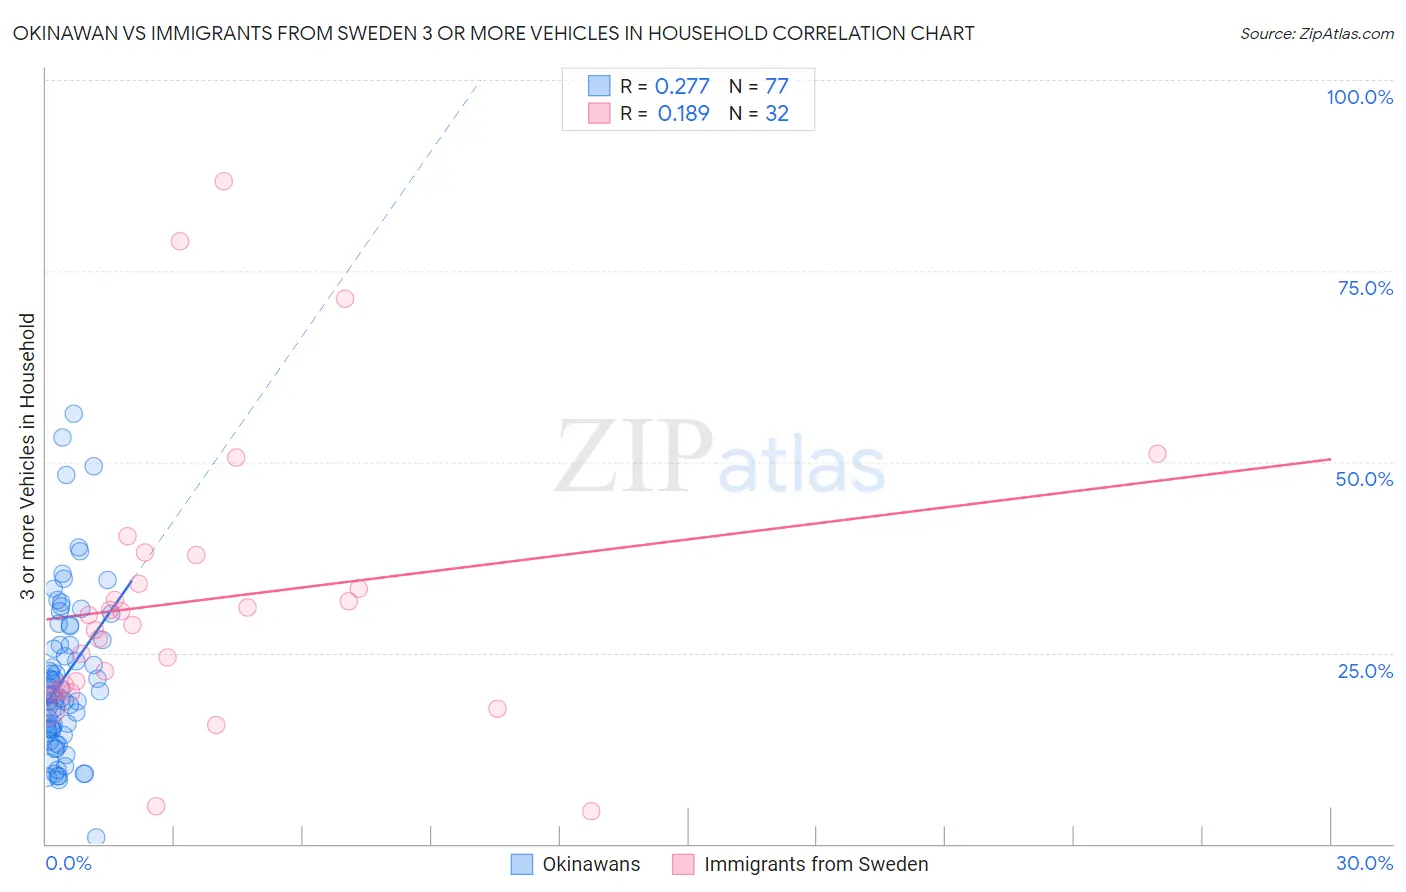
Okinawan vs Immigrants from Sweden 3 or more Vehicles in Household Correlation Chart
The statistical analysis conducted on geographies consisting of 73,703,163 people shows a weak positive correlation between the proportion of Okinawans and percentage of households with 3 or more vehicles available in the United States with a correlation coefficient (R) of 0.277 and weighted average of 17.4%. Similarly, the statistical analysis conducted on geographies consisting of 164,661,279 people shows a poor positive correlation between the proportion of Immigrants from Sweden and percentage of households with 3 or more vehicles available in the United States with a correlation coefficient (R) of 0.189 and weighted average of 19.2%, a difference of 9.9%.
3 or more Vehicles in Household Correlation Summary
| Measurement | Okinawan | Immigrants from Sweden |
| Minimum | 0.75% | 4.3% |
| Maximum | 56.2% | 86.7% |
| Range | 55.5% | 82.4% |
| Mean | 21.7% | 32.0% |
| Median | 19.5% | 29.2% |
| Interquartile 25% (IQ1) | 14.8% | 20.5% |
| Interquartile 75% (IQ3) | 27.6% | 35.9% |
| Interquartile Range (IQR) | 12.8% | 15.4% |
| Standard Deviation (Sample) | 10.7% | 18.6% |
| Standard Deviation (Population) | 10.6% | 18.3% |
Similar Demographics by 3 or more Vehicles in Household
Demographics Similar to Okinawans by 3 or more Vehicles in Household
In terms of 3 or more vehicles in household, the demographic groups most similar to Okinawans are Brazilian (17.4%, a difference of 0.14%), Immigrants from Ukraine (17.5%, a difference of 0.16%), Immigrants from Bahamas (17.4%, a difference of 0.23%), Immigrants from Kazakhstan (17.4%, a difference of 0.25%), and Immigrants from Eastern Europe (17.4%, a difference of 0.29%).
| Demographics | Rating | Rank | 3 or more Vehicles in Household |
| Immigrants | France | 0.6 /100 | #269 | Tragic 17.6% |
| Immigrants | Nepal | 0.6 /100 | #270 | Tragic 17.6% |
| South Americans | 0.6 /100 | #271 | Tragic 17.6% |
| Immigrants | Africa | 0.5 /100 | #272 | Tragic 17.6% |
| Immigrants | Sudan | 0.5 /100 | #273 | Tragic 17.6% |
| Immigrants | Bosnia and Herzegovina | 0.5 /100 | #274 | Tragic 17.5% |
| Immigrants | Ukraine | 0.4 /100 | #275 | Tragic 17.5% |
| Okinawans | 0.4 /100 | #276 | Tragic 17.4% |
| Brazilians | 0.4 /100 | #277 | Tragic 17.4% |
| Immigrants | Bahamas | 0.3 /100 | #278 | Tragic 17.4% |
| Immigrants | Kazakhstan | 0.3 /100 | #279 | Tragic 17.4% |
| Immigrants | Eastern Europe | 0.3 /100 | #280 | Tragic 17.4% |
| Immigrants | Latvia | 0.3 /100 | #281 | Tragic 17.4% |
| Immigrants | Ireland | 0.3 /100 | #282 | Tragic 17.3% |
| Blacks/African Americans | 0.3 /100 | #283 | Tragic 17.3% |
Demographics Similar to Immigrants from Sweden by 3 or more Vehicles in Household
In terms of 3 or more vehicles in household, the demographic groups most similar to Immigrants from Sweden are Immigrants from Hong Kong (19.2%, a difference of 0.060%), Immigrants from Sri Lanka (19.2%, a difference of 0.16%), Immigrants from Kuwait (19.1%, a difference of 0.28%), Indian (Asian) (19.1%, a difference of 0.29%), and Immigrants from Zimbabwe (19.1%, a difference of 0.34%).
| Demographics | Rating | Rank | 3 or more Vehicles in Household |
| Immigrants | South Central Asia | 38.9 /100 | #179 | Fair 19.3% |
| South Africans | 37.5 /100 | #180 | Fair 19.3% |
| Romanians | 37.1 /100 | #181 | Fair 19.3% |
| Cubans | 36.6 /100 | #182 | Fair 19.3% |
| Cajuns | 36.0 /100 | #183 | Fair 19.3% |
| Latvians | 35.7 /100 | #184 | Fair 19.3% |
| Immigrants | Sri Lanka | 30.7 /100 | #185 | Fair 19.2% |
| Immigrants | Sweden | 29.0 /100 | #186 | Fair 19.2% |
| Immigrants | Hong Kong | 28.3 /100 | #187 | Fair 19.2% |
| Immigrants | Kuwait | 26.1 /100 | #188 | Fair 19.1% |
| Indians (Asian) | 26.0 /100 | #189 | Fair 19.1% |
| Immigrants | Zimbabwe | 25.5 /100 | #190 | Fair 19.1% |
| South American Indians | 25.4 /100 | #191 | Fair 19.1% |
| Kenyans | 24.7 /100 | #192 | Fair 19.1% |
| Tsimshian | 24.4 /100 | #193 | Fair 19.1% |