Okinawan vs Immigrants from Sweden In Labor Force | Age 25-29
COMPARE
Okinawan
Immigrants from Sweden
In Labor Force | Age 25-29
In Labor Force | Age 25-29 Comparison
Okinawans
Immigrants from Sweden
85.2%
IN LABOR FORCE | AGE 25-29
97.0/ 100
METRIC RATING
82nd/ 347
METRIC RANK
85.4%
IN LABOR FORCE | AGE 25-29
99.1/ 100
METRIC RATING
70th/ 347
METRIC RANK
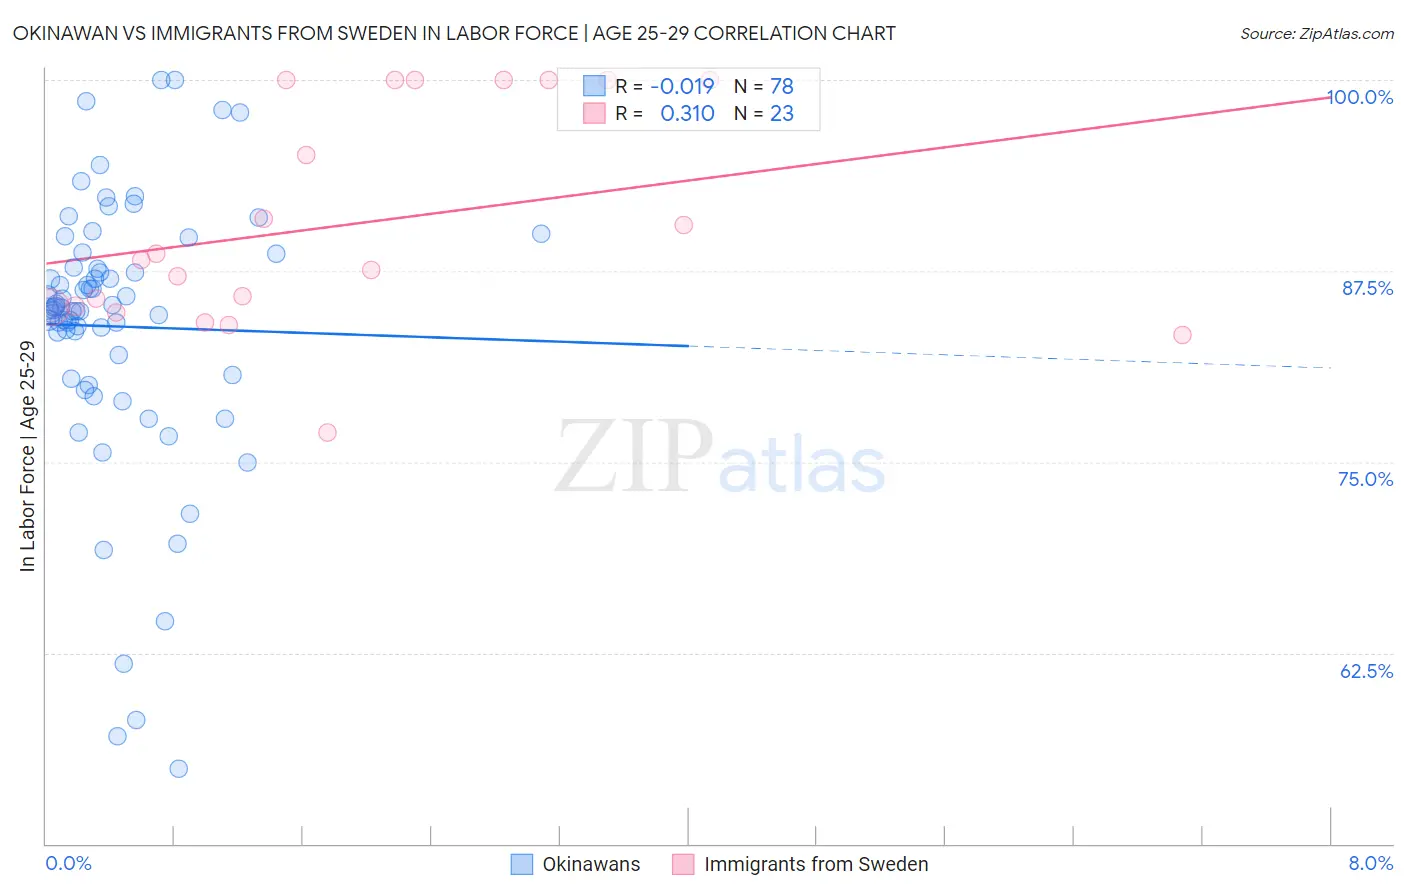
Okinawan vs Immigrants from Sweden In Labor Force | Age 25-29 Correlation Chart
The statistical analysis conducted on geographies consisting of 73,774,164 people shows no correlation between the proportion of Okinawans and labor force participation rate among population between the ages 25 and 29 in the United States with a correlation coefficient (R) of -0.019 and weighted average of 85.2%. Similarly, the statistical analysis conducted on geographies consisting of 164,705,028 people shows a mild positive correlation between the proportion of Immigrants from Sweden and labor force participation rate among population between the ages 25 and 29 in the United States with a correlation coefficient (R) of 0.310 and weighted average of 85.4%, a difference of 0.22%.
In Labor Force | Age 25-29 Correlation Summary
| Measurement | Okinawan | Immigrants from Sweden |
| Minimum | 54.9% | 76.9% |
| Maximum | 100.0% | 100.0% |
| Range | 45.1% | 23.1% |
| Mean | 83.9% | 90.6% |
| Median | 85.1% | 88.2% |
| Interquartile 25% (IQ1) | 80.7% | 85.1% |
| Interquartile 75% (IQ3) | 87.7% | 100.0% |
| Interquartile Range (IQR) | 7.0% | 14.9% |
| Standard Deviation (Sample) | 8.9% | 7.2% |
| Standard Deviation (Population) | 8.9% | 7.0% |
Demographics Similar to Okinawans and Immigrants from Sweden by In Labor Force | Age 25-29
In terms of in labor force | age 25-29, the demographic groups most similar to Okinawans are Immigrants from Europe (85.2%, a difference of 0.010%), Immigrants from Eastern Europe (85.2%, a difference of 0.010%), Immigrants from Africa (85.2%, a difference of 0.010%), Immigrants from Northern Europe (85.2%, a difference of 0.020%), and Ukrainian (85.2%, a difference of 0.020%). Similarly, the demographic groups most similar to Immigrants from Sweden are Menominee (85.4%, a difference of 0.0%), Immigrants from Cameroon (85.4%, a difference of 0.020%), Kenyan (85.4%, a difference of 0.020%), Immigrants from Turkey (85.4%, a difference of 0.030%), and Immigrants from Scotland (85.4%, a difference of 0.040%).
| Demographics | Rating | Rank | In Labor Force | Age 25-29 |
| Immigrants | Scotland | 99.3 /100 | #66 | Exceptional 85.4% |
| Immigrants | Turkey | 99.2 /100 | #67 | Exceptional 85.4% |
| Immigrants | Cameroon | 99.2 /100 | #68 | Exceptional 85.4% |
| Menominee | 99.1 /100 | #69 | Exceptional 85.4% |
| Immigrants | Sweden | 99.1 /100 | #70 | Exceptional 85.4% |
| Kenyans | 99.0 /100 | #71 | Exceptional 85.4% |
| Immigrants | Australia | 98.9 /100 | #72 | Exceptional 85.3% |
| Russians | 98.8 /100 | #73 | Exceptional 85.3% |
| Soviet Union | 98.5 /100 | #74 | Exceptional 85.3% |
| Brazilians | 98.3 /100 | #75 | Exceptional 85.3% |
| Germans | 98.1 /100 | #76 | Exceptional 85.3% |
| Immigrants | South Central Asia | 97.9 /100 | #77 | Exceptional 85.2% |
| Immigrants | Egypt | 97.7 /100 | #78 | Exceptional 85.2% |
| Immigrants | Northern Africa | 97.6 /100 | #79 | Exceptional 85.2% |
| Immigrants | Zimbabwe | 97.6 /100 | #80 | Exceptional 85.2% |
| Immigrants | Northern Europe | 97.2 /100 | #81 | Exceptional 85.2% |
| Okinawans | 97.0 /100 | #82 | Exceptional 85.2% |
| Immigrants | Europe | 96.8 /100 | #83 | Exceptional 85.2% |
| Immigrants | Eastern Europe | 96.8 /100 | #84 | Exceptional 85.2% |
| Immigrants | Africa | 96.7 /100 | #85 | Exceptional 85.2% |
| Ukrainians | 96.7 /100 | #86 | Exceptional 85.2% |