Nonimmigrants vs Romanian 2 or more Vehicles in Household
COMPARE
Nonimmigrants
Romanian
2 or more Vehicles in Household
2 or more Vehicles in Household Comparison
Nonimmigrants
Romanians
58.8%
2 OR MORE VEHICLES IN HOUSEHOLD
99.8/ 100
METRIC RATING
62nd/ 347
METRIC RANK
55.5%
2 OR MORE VEHICLES IN HOUSEHOLD
55.8/ 100
METRIC RATING
170th/ 347
METRIC RANK
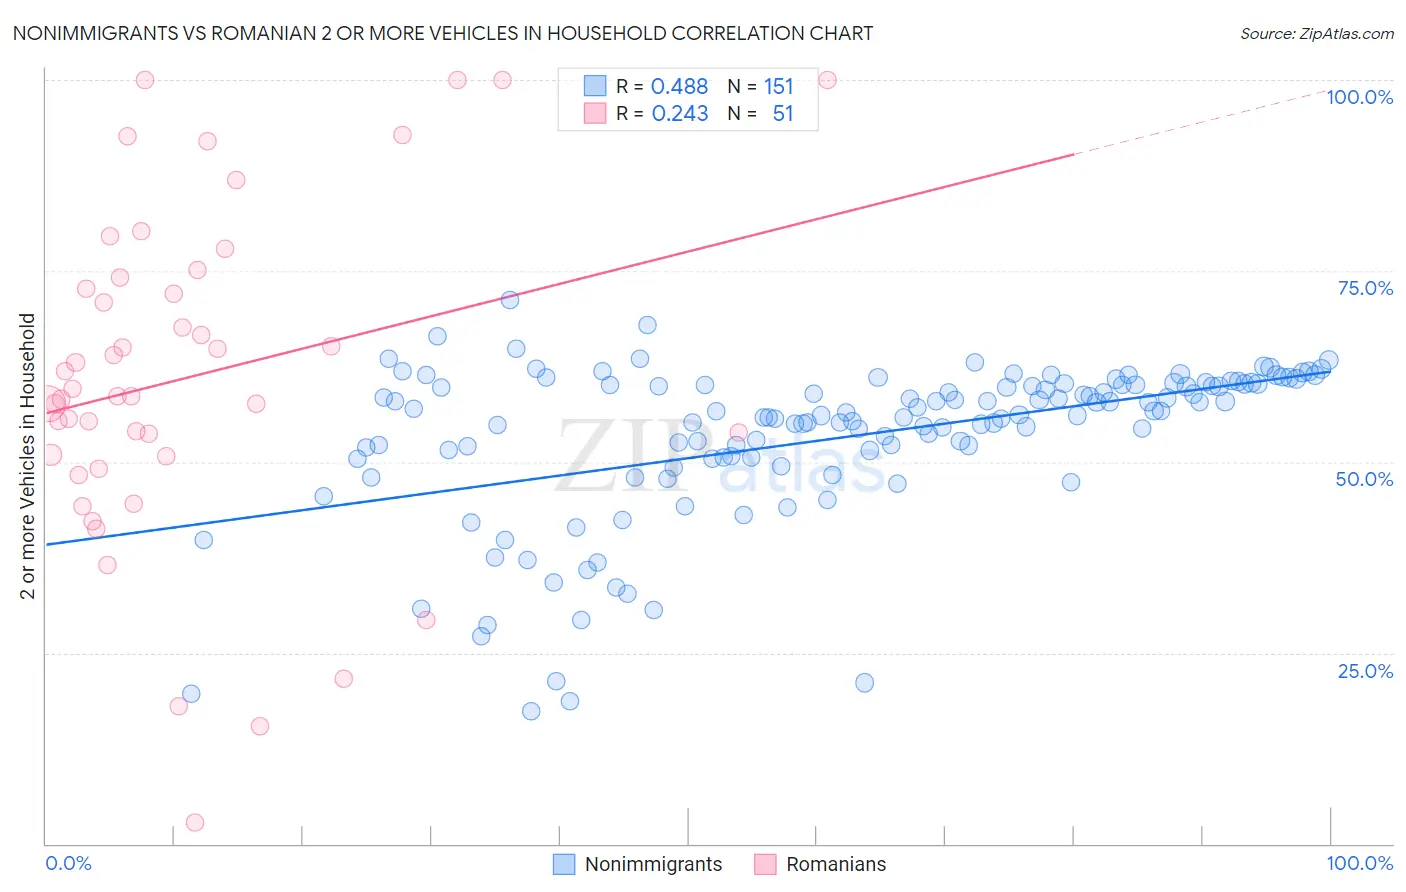
Nonimmigrants vs Romanian 2 or more Vehicles in Household Correlation Chart
The statistical analysis conducted on geographies consisting of 584,662,841 people shows a moderate positive correlation between the proportion of Nonimmigrants and percentage of households with 2 or more vehicles available in the United States with a correlation coefficient (R) of 0.488 and weighted average of 58.8%. Similarly, the statistical analysis conducted on geographies consisting of 377,750,071 people shows a weak positive correlation between the proportion of Romanians and percentage of households with 2 or more vehicles available in the United States with a correlation coefficient (R) of 0.243 and weighted average of 55.5%, a difference of 5.9%.
2 or more Vehicles in Household Correlation Summary
| Measurement | Nonimmigrants | Romanian |
| Minimum | 17.3% | 2.7% |
| Maximum | 71.2% | 100.0% |
| Range | 53.9% | 97.3% |
| Mean | 53.2% | 61.1% |
| Median | 56.1% | 58.6% |
| Interquartile 25% (IQ1) | 50.6% | 50.7% |
| Interquartile 75% (IQ3) | 60.1% | 74.2% |
| Interquartile Range (IQR) | 9.6% | 23.5% |
| Standard Deviation (Sample) | 10.5% | 22.0% |
| Standard Deviation (Population) | 10.5% | 21.8% |
Similar Demographics by 2 or more Vehicles in Household
Demographics Similar to Nonimmigrants by 2 or more Vehicles in Household
In terms of 2 or more vehicles in household, the demographic groups most similar to Nonimmigrants are Osage (58.8%, a difference of 0.040%), Mexican American Indian (58.7%, a difference of 0.070%), French Canadian (58.9%, a difference of 0.17%), Spanish American (58.9%, a difference of 0.19%), and Immigrants from Scotland (58.9%, a difference of 0.22%).
| Demographics | Rating | Rank | 2 or more Vehicles in Household |
| Luxembourgers | 99.9 /100 | #55 | Exceptional 59.1% |
| Chickasaw | 99.9 /100 | #56 | Exceptional 59.0% |
| Afghans | 99.9 /100 | #57 | Exceptional 59.0% |
| Immigrants | Scotland | 99.8 /100 | #58 | Exceptional 58.9% |
| Spanish Americans | 99.8 /100 | #59 | Exceptional 58.9% |
| French Canadians | 99.8 /100 | #60 | Exceptional 58.9% |
| Osage | 99.8 /100 | #61 | Exceptional 58.8% |
| Immigrants | Nonimmigrants | 99.8 /100 | #62 | Exceptional 58.8% |
| Mexican American Indians | 99.8 /100 | #63 | Exceptional 58.7% |
| Portuguese | 99.7 /100 | #64 | Exceptional 58.6% |
| Immigrants | Central America | 99.7 /100 | #65 | Exceptional 58.6% |
| Croatians | 99.7 /100 | #66 | Exceptional 58.6% |
| Laotians | 99.7 /100 | #67 | Exceptional 58.6% |
| Canadians | 99.7 /100 | #68 | Exceptional 58.6% |
| Pennsylvania Germans | 99.7 /100 | #69 | Exceptional 58.5% |
Demographics Similar to Romanians by 2 or more Vehicles in Household
In terms of 2 or more vehicles in household, the demographic groups most similar to Romanians are Immigrants from Austria (55.5%, a difference of 0.020%), French American Indian (55.5%, a difference of 0.030%), Immigrants from Costa Rica (55.4%, a difference of 0.060%), Kenyan (55.5%, a difference of 0.090%), and Immigrants from Sri Lanka (55.5%, a difference of 0.10%).
| Demographics | Rating | Rank | 2 or more Vehicles in Household |
| Immigrants | Zimbabwe | 60.2 /100 | #163 | Good 55.6% |
| Dutch West Indians | 59.8 /100 | #164 | Average 55.6% |
| Immigrants | El Salvador | 59.4 /100 | #165 | Average 55.6% |
| Immigrants | Sri Lanka | 58.3 /100 | #166 | Average 55.5% |
| Kenyans | 58.1 /100 | #167 | Average 55.5% |
| French American Indians | 56.7 /100 | #168 | Average 55.5% |
| Immigrants | Austria | 56.3 /100 | #169 | Average 55.5% |
| Romanians | 55.8 /100 | #170 | Average 55.5% |
| Immigrants | Costa Rica | 54.4 /100 | #171 | Average 55.4% |
| Immigrants | Nicaragua | 51.6 /100 | #172 | Average 55.4% |
| Immigrants | Western Europe | 51.4 /100 | #173 | Average 55.4% |
| Navajo | 50.0 /100 | #174 | Average 55.3% |
| Immigrants | Denmark | 49.4 /100 | #175 | Average 55.3% |
| Immigrants | Cuba | 47.0 /100 | #176 | Average 55.3% |
| Menominee | 46.2 /100 | #177 | Average 55.3% |