Laotian vs Ecuadorian No Vehicles in Household
COMPARE
Laotian
Ecuadorian
No Vehicles in Household
No Vehicles in Household Comparison
Laotians
Ecuadorians
9.1%
NO VEHICLES IN HOUSEHOLD
97.8/ 100
METRIC RATING
106th/ 347
METRIC RANK
22.8%
NO VEHICLES IN HOUSEHOLD
0.0/ 100
METRIC RATING
329th/ 347
METRIC RANK
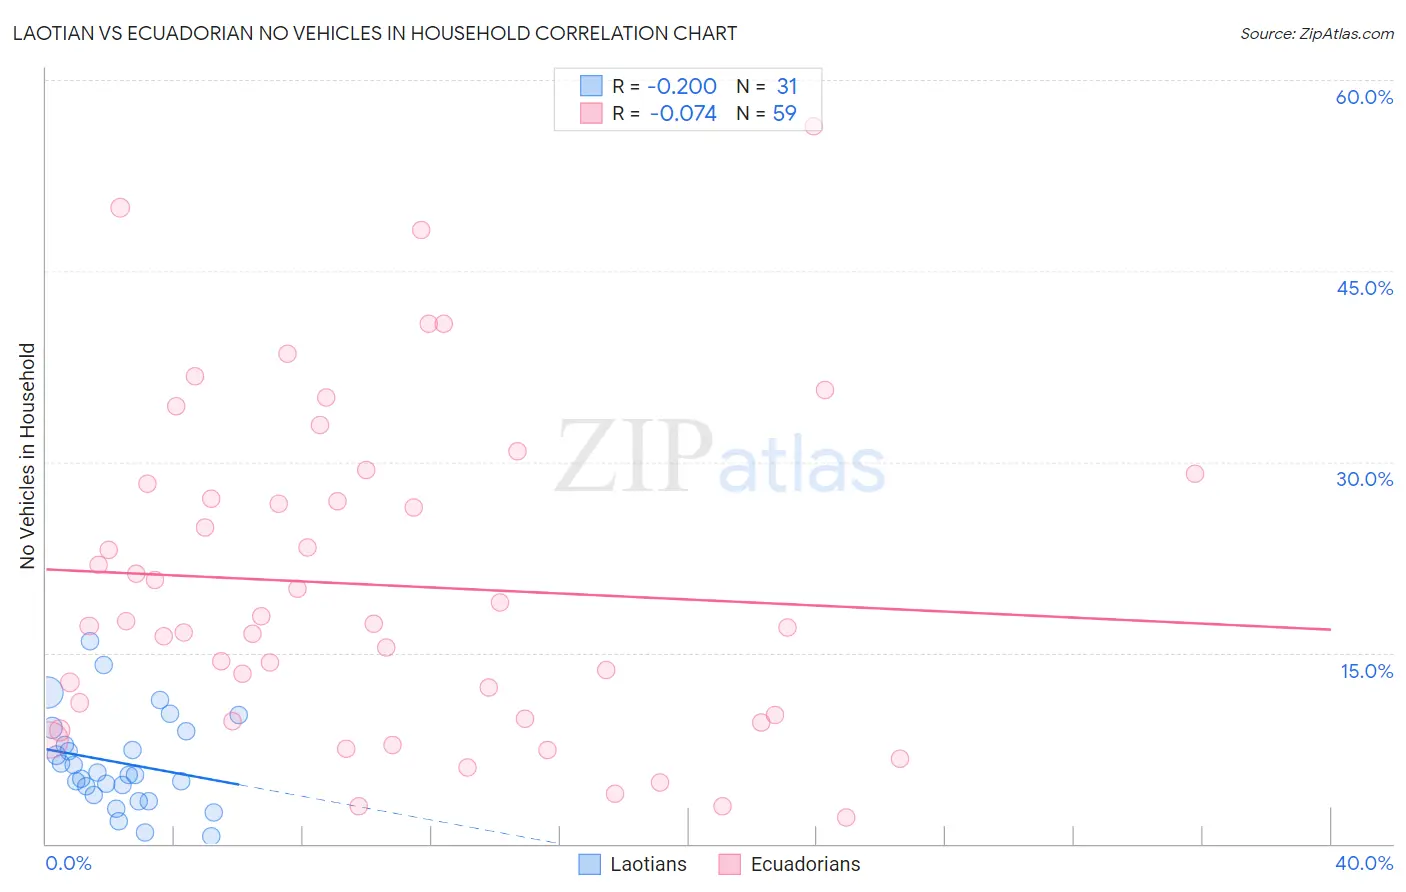
Laotian vs Ecuadorian No Vehicles in Household Correlation Chart
The statistical analysis conducted on geographies consisting of 224,346,725 people shows a poor negative correlation between the proportion of Laotians and percentage of households with no vehicle available in the United States with a correlation coefficient (R) of -0.200 and weighted average of 9.1%. Similarly, the statistical analysis conducted on geographies consisting of 317,233,310 people shows a slight negative correlation between the proportion of Ecuadorians and percentage of households with no vehicle available in the United States with a correlation coefficient (R) of -0.074 and weighted average of 22.8%, a difference of 151.1%.
No Vehicles in Household Correlation Summary
| Measurement | Laotian | Ecuadorian |
| Minimum | 0.59% | 2.1% |
| Maximum | 15.9% | 56.4% |
| Range | 15.3% | 54.3% |
| Mean | 6.4% | 20.3% |
| Median | 5.4% | 17.3% |
| Interquartile 25% (IQ1) | 3.8% | 9.8% |
| Interquartile 75% (IQ3) | 8.9% | 28.3% |
| Interquartile Range (IQR) | 5.0% | 18.5% |
| Standard Deviation (Sample) | 3.7% | 12.7% |
| Standard Deviation (Population) | 3.6% | 12.5% |
Similar Demographics by No Vehicles in Household
Demographics Similar to Laotians by No Vehicles in Household
In terms of no vehicles in household, the demographic groups most similar to Laotians are Spanish American (9.1%, a difference of 0.090%), Zimbabwean (9.0%, a difference of 0.25%), Hispanic or Latino (9.1%, a difference of 0.26%), Mexican American Indian (9.1%, a difference of 0.35%), and Maltese (9.1%, a difference of 0.48%).
| Demographics | Rating | Rank | No Vehicles in Household |
| Bulgarians | 98.4 /100 | #99 | Exceptional 9.0% |
| Asians | 98.3 /100 | #100 | Exceptional 9.0% |
| Pakistanis | 98.3 /100 | #101 | Exceptional 9.0% |
| Yugoslavians | 98.3 /100 | #102 | Exceptional 9.0% |
| Seminole | 98.3 /100 | #103 | Exceptional 9.0% |
| Zimbabweans | 98.0 /100 | #104 | Exceptional 9.0% |
| Spanish Americans | 97.9 /100 | #105 | Exceptional 9.1% |
| Laotians | 97.8 /100 | #106 | Exceptional 9.1% |
| Hispanics or Latinos | 97.7 /100 | #107 | Exceptional 9.1% |
| Mexican American Indians | 97.6 /100 | #108 | Exceptional 9.1% |
| Maltese | 97.6 /100 | #109 | Exceptional 9.1% |
| Delaware | 97.2 /100 | #110 | Exceptional 9.2% |
| Immigrants | Kuwait | 95.1 /100 | #111 | Exceptional 9.4% |
| Armenians | 95.0 /100 | #112 | Exceptional 9.4% |
| Immigrants | Netherlands | 94.8 /100 | #113 | Exceptional 9.4% |
Demographics Similar to Ecuadorians by No Vehicles in Household
In terms of no vehicles in household, the demographic groups most similar to Ecuadorians are Immigrants from Dominica (22.2%, a difference of 2.3%), West Indian (23.7%, a difference of 4.2%), Trinidadian and Tobagonian (23.7%, a difference of 4.4%), Immigrants from Ecuador (23.8%, a difference of 4.7%), and Immigrants from Senegal (21.1%, a difference of 7.6%).
| Demographics | Rating | Rank | No Vehicles in Household |
| Immigrants | Cabo Verde | 0.0 /100 | #322 | Tragic 18.4% |
| Immigrants | Yemen | 0.0 /100 | #323 | Tragic 19.5% |
| Immigrants | Caribbean | 0.0 /100 | #324 | Tragic 19.6% |
| Senegalese | 0.0 /100 | #325 | Tragic 19.8% |
| Immigrants | West Indies | 0.0 /100 | #326 | Tragic 20.5% |
| Immigrants | Senegal | 0.0 /100 | #327 | Tragic 21.1% |
| Immigrants | Dominica | 0.0 /100 | #328 | Tragic 22.2% |
| Ecuadorians | 0.0 /100 | #329 | Tragic 22.8% |
| West Indians | 0.0 /100 | #330 | Tragic 23.7% |
| Trinidadians and Tobagonians | 0.0 /100 | #331 | Tragic 23.7% |
| Immigrants | Ecuador | 0.0 /100 | #332 | Tragic 23.8% |
| Immigrants | Trinidad and Tobago | 0.0 /100 | #333 | Tragic 24.6% |
| Immigrants | Bangladesh | 0.0 /100 | #334 | Tragic 25.8% |
| Barbadians | 0.0 /100 | #335 | Tragic 26.1% |
| Vietnamese | 0.0 /100 | #336 | Tragic 26.2% |