Immigrants from Western Europe vs Ecuadorian No Vehicles in Household
COMPARE
Immigrants from Western Europe
Ecuadorian
No Vehicles in Household
No Vehicles in Household Comparison
Immigrants from Western Europe
Ecuadorians
10.9%
NO VEHICLES IN HOUSEHOLD
19.1/ 100
METRIC RATING
201st/ 347
METRIC RANK
22.8%
NO VEHICLES IN HOUSEHOLD
0.0/ 100
METRIC RATING
329th/ 347
METRIC RANK
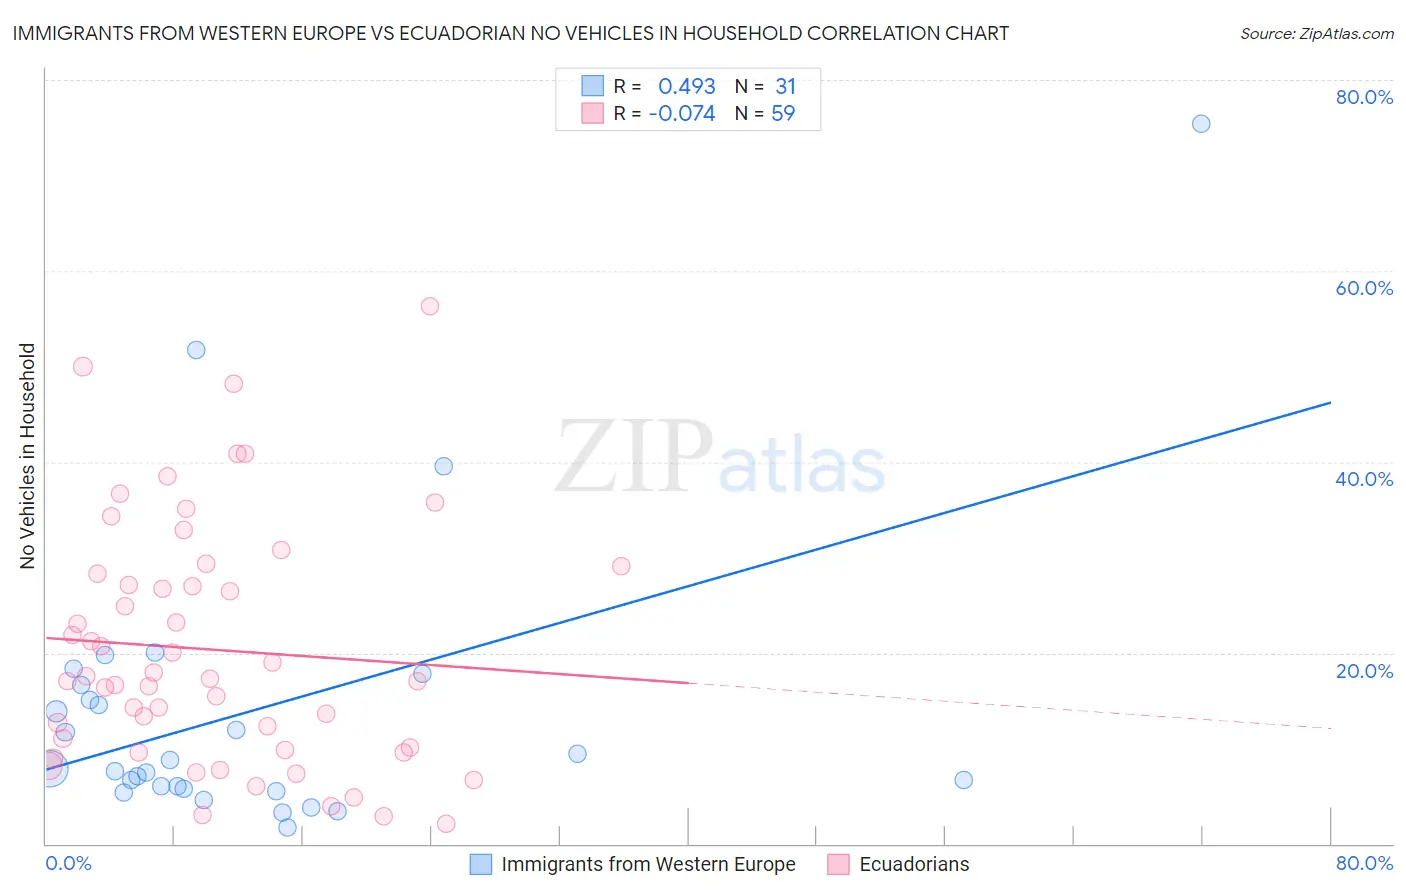
Immigrants from Western Europe vs Ecuadorian No Vehicles in Household Correlation Chart
The statistical analysis conducted on geographies consisting of 491,986,694 people shows a moderate positive correlation between the proportion of Immigrants from Western Europe and percentage of households with no vehicle available in the United States with a correlation coefficient (R) of 0.493 and weighted average of 10.9%. Similarly, the statistical analysis conducted on geographies consisting of 317,233,310 people shows a slight negative correlation between the proportion of Ecuadorians and percentage of households with no vehicle available in the United States with a correlation coefficient (R) of -0.074 and weighted average of 22.8%, a difference of 108.5%.
No Vehicles in Household Correlation Summary
| Measurement | Immigrants from Western Europe | Ecuadorian |
| Minimum | 1.7% | 2.1% |
| Maximum | 75.4% | 56.4% |
| Range | 73.7% | 54.3% |
| Mean | 14.0% | 20.3% |
| Median | 7.9% | 17.3% |
| Interquartile 25% (IQ1) | 5.8% | 9.8% |
| Interquartile 75% (IQ3) | 16.6% | 28.3% |
| Interquartile Range (IQR) | 10.8% | 18.5% |
| Standard Deviation (Sample) | 15.5% | 12.7% |
| Standard Deviation (Population) | 15.2% | 12.5% |
Similar Demographics by No Vehicles in Household
Demographics Similar to Immigrants from Western Europe by No Vehicles in Household
In terms of no vehicles in household, the demographic groups most similar to Immigrants from Western Europe are Cambodian (10.9%, a difference of 0.11%), Romanian (10.9%, a difference of 0.27%), Iroquois (10.9%, a difference of 0.34%), Immigrants from Asia (10.9%, a difference of 0.44%), and Guatemalan (11.0%, a difference of 0.68%).
| Demographics | Rating | Rank | No Vehicles in Household |
| Pueblo | 27.0 /100 | #194 | Fair 10.8% |
| Immigrants | Brazil | 26.3 /100 | #195 | Fair 10.8% |
| Central Americans | 24.3 /100 | #196 | Fair 10.8% |
| Shoshone | 24.1 /100 | #197 | Fair 10.8% |
| Immigrants | Sweden | 22.9 /100 | #198 | Fair 10.8% |
| Immigrants | Asia | 21.3 /100 | #199 | Fair 10.9% |
| Cambodians | 19.6 /100 | #200 | Poor 10.9% |
| Immigrants | Western Europe | 19.1 /100 | #201 | Poor 10.9% |
| Romanians | 17.9 /100 | #202 | Poor 10.9% |
| Iroquois | 17.6 /100 | #203 | Poor 10.9% |
| Guatemalans | 16.1 /100 | #204 | Poor 11.0% |
| Immigrants | Chile | 15.9 /100 | #205 | Poor 11.0% |
| Somalis | 15.9 /100 | #206 | Poor 11.0% |
| Sierra Leoneans | 15.7 /100 | #207 | Poor 11.0% |
| Immigrants | Italy | 15.6 /100 | #208 | Poor 11.0% |
Demographics Similar to Ecuadorians by No Vehicles in Household
In terms of no vehicles in household, the demographic groups most similar to Ecuadorians are Immigrants from Dominica (22.2%, a difference of 2.3%), West Indian (23.7%, a difference of 4.2%), Trinidadian and Tobagonian (23.7%, a difference of 4.4%), Immigrants from Ecuador (23.8%, a difference of 4.7%), and Immigrants from Senegal (21.1%, a difference of 7.6%).
| Demographics | Rating | Rank | No Vehicles in Household |
| Immigrants | Cabo Verde | 0.0 /100 | #322 | Tragic 18.4% |
| Immigrants | Yemen | 0.0 /100 | #323 | Tragic 19.5% |
| Immigrants | Caribbean | 0.0 /100 | #324 | Tragic 19.6% |
| Senegalese | 0.0 /100 | #325 | Tragic 19.8% |
| Immigrants | West Indies | 0.0 /100 | #326 | Tragic 20.5% |
| Immigrants | Senegal | 0.0 /100 | #327 | Tragic 21.1% |
| Immigrants | Dominica | 0.0 /100 | #328 | Tragic 22.2% |
| Ecuadorians | 0.0 /100 | #329 | Tragic 22.8% |
| West Indians | 0.0 /100 | #330 | Tragic 23.7% |
| Trinidadians and Tobagonians | 0.0 /100 | #331 | Tragic 23.7% |
| Immigrants | Ecuador | 0.0 /100 | #332 | Tragic 23.8% |
| Immigrants | Trinidad and Tobago | 0.0 /100 | #333 | Tragic 24.6% |
| Immigrants | Bangladesh | 0.0 /100 | #334 | Tragic 25.8% |
| Barbadians | 0.0 /100 | #335 | Tragic 26.1% |
| Vietnamese | 0.0 /100 | #336 | Tragic 26.2% |