Laotian vs Ecuadorian Currently Married
COMPARE
Laotian
Ecuadorian
Currently Married
Currently Married Comparison
Laotians
Ecuadorians
47.4%
CURRENTLY MARRIED
86.6/ 100
METRIC RATING
124th/ 347
METRIC RANK
43.6%
CURRENTLY MARRIED
0.1/ 100
METRIC RATING
266th/ 347
METRIC RANK
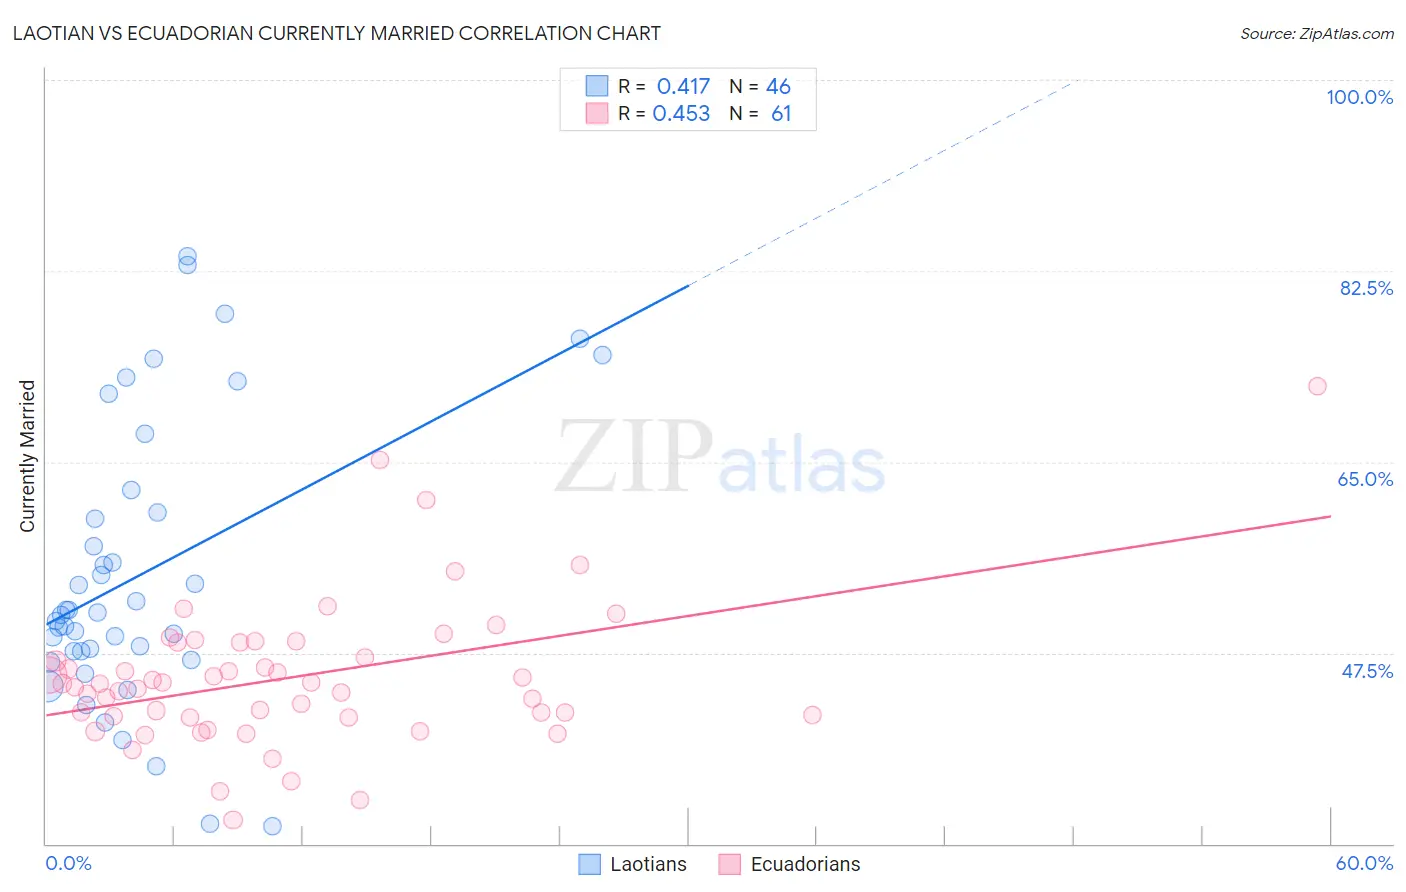
Laotian vs Ecuadorian Currently Married Correlation Chart
The statistical analysis conducted on geographies consisting of 224,816,761 people shows a moderate positive correlation between the proportion of Laotians and percentage of population currently married in the United States with a correlation coefficient (R) of 0.417 and weighted average of 47.4%. Similarly, the statistical analysis conducted on geographies consisting of 317,807,476 people shows a moderate positive correlation between the proportion of Ecuadorians and percentage of population currently married in the United States with a correlation coefficient (R) of 0.453 and weighted average of 43.6%, a difference of 8.8%.
Currently Married Correlation Summary
| Measurement | Laotian | Ecuadorian |
| Minimum | 31.6% | 32.2% |
| Maximum | 83.9% | 71.9% |
| Range | 52.3% | 39.7% |
| Mean | 54.7% | 45.2% |
| Median | 51.1% | 44.6% |
| Interquartile 25% (IQ1) | 47.6% | 41.7% |
| Interquartile 75% (IQ3) | 60.4% | 48.4% |
| Interquartile Range (IQR) | 12.7% | 6.8% |
| Standard Deviation (Sample) | 12.9% | 6.7% |
| Standard Deviation (Population) | 12.8% | 6.7% |
Similar Demographics by Currently Married
Demographics Similar to Laotians by Currently Married
In terms of currently married, the demographic groups most similar to Laotians are Immigrants from Kazakhstan (47.4%, a difference of 0.050%), Okinawan (47.4%, a difference of 0.10%), Osage (47.5%, a difference of 0.11%), Immigrants from Jordan (47.4%, a difference of 0.13%), and New Zealander (47.4%, a difference of 0.13%).
| Demographics | Rating | Rank | Currently Married |
| Puget Sound Salish | 90.3 /100 | #117 | Exceptional 47.6% |
| Immigrants | Philippines | 90.2 /100 | #118 | Exceptional 47.6% |
| Australians | 90.2 /100 | #119 | Exceptional 47.6% |
| Syrians | 88.9 /100 | #120 | Excellent 47.5% |
| Immigrants | Croatia | 88.6 /100 | #121 | Excellent 47.5% |
| Osage | 87.9 /100 | #122 | Excellent 47.5% |
| Immigrants | Kazakhstan | 87.2 /100 | #123 | Excellent 47.4% |
| Laotians | 86.6 /100 | #124 | Excellent 47.4% |
| Okinawans | 85.3 /100 | #125 | Excellent 47.4% |
| Immigrants | Jordan | 84.9 /100 | #126 | Excellent 47.4% |
| New Zealanders | 84.9 /100 | #127 | Excellent 47.4% |
| Portuguese | 84.2 /100 | #128 | Excellent 47.3% |
| Sri Lankans | 83.2 /100 | #129 | Excellent 47.3% |
| Immigrants | Iraq | 82.8 /100 | #130 | Excellent 47.3% |
| Icelanders | 82.4 /100 | #131 | Excellent 47.3% |
Demographics Similar to Ecuadorians by Currently Married
In terms of currently married, the demographic groups most similar to Ecuadorians are Immigrants from Eritrea (43.6%, a difference of 0.030%), Spanish American Indian (43.6%, a difference of 0.030%), Immigrants from Bangladesh (43.6%, a difference of 0.070%), Sudanese (43.7%, a difference of 0.15%), and Immigrants from Cuba (43.7%, a difference of 0.16%).
| Demographics | Rating | Rank | Currently Married |
| Immigrants | Sierra Leone | 0.1 /100 | #259 | Tragic 43.8% |
| Immigrants | Latin America | 0.1 /100 | #260 | Tragic 43.8% |
| Immigrants | Nicaragua | 0.1 /100 | #261 | Tragic 43.7% |
| Bangladeshis | 0.1 /100 | #262 | Tragic 43.7% |
| Immigrants | Cuba | 0.1 /100 | #263 | Tragic 43.7% |
| Sudanese | 0.1 /100 | #264 | Tragic 43.7% |
| Immigrants | Bangladesh | 0.1 /100 | #265 | Tragic 43.6% |
| Ecuadorians | 0.1 /100 | #266 | Tragic 43.6% |
| Immigrants | Eritrea | 0.1 /100 | #267 | Tragic 43.6% |
| Spanish American Indians | 0.1 /100 | #268 | Tragic 43.6% |
| Immigrants | Sudan | 0.1 /100 | #269 | Tragic 43.5% |
| Salvadorans | 0.1 /100 | #270 | Tragic 43.5% |
| Bermudans | 0.1 /100 | #271 | Tragic 43.5% |
| Indonesians | 0.1 /100 | #272 | Tragic 43.5% |
| Yaqui | 0.1 /100 | #273 | Tragic 43.4% |