Immigrants from South America vs Nigerian 2 or more Vehicles in Household
COMPARE
Immigrants from South America
Nigerian
2 or more Vehicles in Household
2 or more Vehicles in Household Comparison
Immigrants from South America
Nigerians
50.2%
2 OR MORE VEHICLES IN HOUSEHOLD
0.0/ 100
METRIC RATING
302nd/ 347
METRIC RANK
52.8%
2 OR MORE VEHICLES IN HOUSEHOLD
0.9/ 100
METRIC RATING
253rd/ 347
METRIC RANK
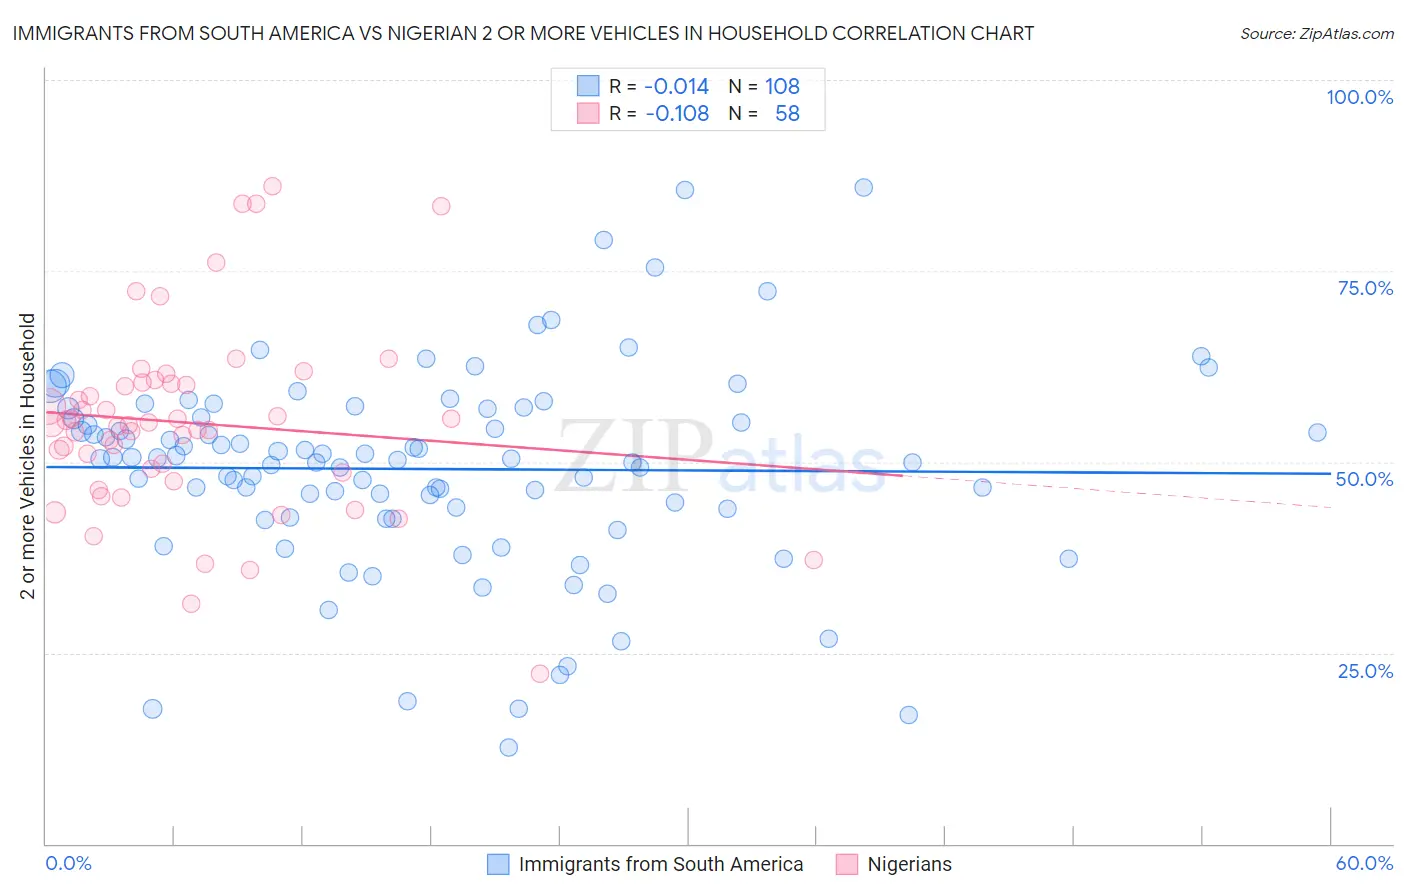
Immigrants from South America vs Nigerian 2 or more Vehicles in Household Correlation Chart
The statistical analysis conducted on geographies consisting of 486,071,920 people shows no correlation between the proportion of Immigrants from South America and percentage of households with 2 or more vehicles available in the United States with a correlation coefficient (R) of -0.014 and weighted average of 50.2%. Similarly, the statistical analysis conducted on geographies consisting of 332,498,440 people shows a poor negative correlation between the proportion of Nigerians and percentage of households with 2 or more vehicles available in the United States with a correlation coefficient (R) of -0.108 and weighted average of 52.8%, a difference of 5.2%.
2 or more Vehicles in Household Correlation Summary
| Measurement | Immigrants from South America | Nigerian |
| Minimum | 12.6% | 22.3% |
| Maximum | 86.0% | 86.1% |
| Range | 73.3% | 63.8% |
| Mean | 49.1% | 55.1% |
| Median | 50.5% | 54.8% |
| Interquartile 25% (IQ1) | 43.3% | 48.7% |
| Interquartile 75% (IQ3) | 56.5% | 60.2% |
| Interquartile Range (IQR) | 13.2% | 11.5% |
| Standard Deviation (Sample) | 13.3% | 12.4% |
| Standard Deviation (Population) | 13.2% | 12.3% |
Similar Demographics by 2 or more Vehicles in Household
Demographics Similar to Immigrants from South America by 2 or more Vehicles in Household
In terms of 2 or more vehicles in household, the demographic groups most similar to Immigrants from South America are Immigrants from Greece (50.2%, a difference of 0.060%), Immigrants from Russia (50.3%, a difference of 0.24%), Immigrants from Morocco (50.3%, a difference of 0.28%), Paraguayan (50.3%, a difference of 0.31%), and Tohono O'odham (50.0%, a difference of 0.37%).
| Demographics | Rating | Rank | 2 or more Vehicles in Household |
| Cypriots | 0.0 /100 | #295 | Tragic 50.6% |
| Immigrants | Somalia | 0.0 /100 | #296 | Tragic 50.5% |
| Immigrants | Spain | 0.0 /100 | #297 | Tragic 50.4% |
| Paraguayans | 0.0 /100 | #298 | Tragic 50.3% |
| Immigrants | Morocco | 0.0 /100 | #299 | Tragic 50.3% |
| Immigrants | Russia | 0.0 /100 | #300 | Tragic 50.3% |
| Immigrants | Greece | 0.0 /100 | #301 | Tragic 50.2% |
| Immigrants | South America | 0.0 /100 | #302 | Tragic 50.2% |
| Tohono O'odham | 0.0 /100 | #303 | Tragic 50.0% |
| Immigrants | Belize | 0.0 /100 | #304 | Tragic 49.9% |
| Immigrants | Western Africa | 0.0 /100 | #305 | Tragic 49.4% |
| Immigrants | Israel | 0.0 /100 | #306 | Tragic 49.2% |
| Hopi | 0.0 /100 | #307 | Tragic 49.0% |
| Albanians | 0.0 /100 | #308 | Tragic 49.0% |
| Moroccans | 0.0 /100 | #309 | Tragic 48.8% |
Demographics Similar to Nigerians by 2 or more Vehicles in Household
In terms of 2 or more vehicles in household, the demographic groups most similar to Nigerians are Immigrants from Portugal (52.8%, a difference of 0.050%), Immigrants from Sudan (52.8%, a difference of 0.060%), Immigrants from Brazil (52.8%, a difference of 0.10%), Mongolian (52.8%, a difference of 0.10%), and Colombian (52.9%, a difference of 0.15%).
| Demographics | Rating | Rank | 2 or more Vehicles in Household |
| Immigrants | Nigeria | 1.2 /100 | #246 | Tragic 52.9% |
| Sierra Leoneans | 1.2 /100 | #247 | Tragic 52.9% |
| Colombians | 1.1 /100 | #248 | Tragic 52.9% |
| Immigrants | Brazil | 1.0 /100 | #249 | Tragic 52.8% |
| Mongolians | 1.0 /100 | #250 | Tragic 52.8% |
| Immigrants | Sudan | 1.0 /100 | #251 | Tragic 52.8% |
| Immigrants | Portugal | 1.0 /100 | #252 | Tragic 52.8% |
| Nigerians | 0.9 /100 | #253 | Tragic 52.8% |
| Immigrants | Malaysia | 0.8 /100 | #254 | Tragic 52.7% |
| Uruguayans | 0.7 /100 | #255 | Tragic 52.7% |
| Immigrants | Eritrea | 0.7 /100 | #256 | Tragic 52.6% |
| Immigrants | Hong Kong | 0.6 /100 | #257 | Tragic 52.6% |
| Central American Indians | 0.6 /100 | #258 | Tragic 52.5% |
| Alsatians | 0.6 /100 | #259 | Tragic 52.5% |
| Immigrants | Bahamas | 0.5 /100 | #260 | Tragic 52.5% |