Immigrants from Ethiopia vs Immigrants from Northern Africa 2 or more Vehicles in Household
COMPARE
Immigrants from Ethiopia
Immigrants from Northern Africa
2 or more Vehicles in Household
2 or more Vehicles in Household Comparison
Immigrants from Ethiopia
Immigrants from Northern Africa
53.0%
2 OR MORE VEHICLES IN HOUSEHOLD
1.5/ 100
METRIC RATING
245th/ 347
METRIC RANK
52.3%
2 OR MORE VEHICLES IN HOUSEHOLD
0.4/ 100
METRIC RATING
262nd/ 347
METRIC RANK
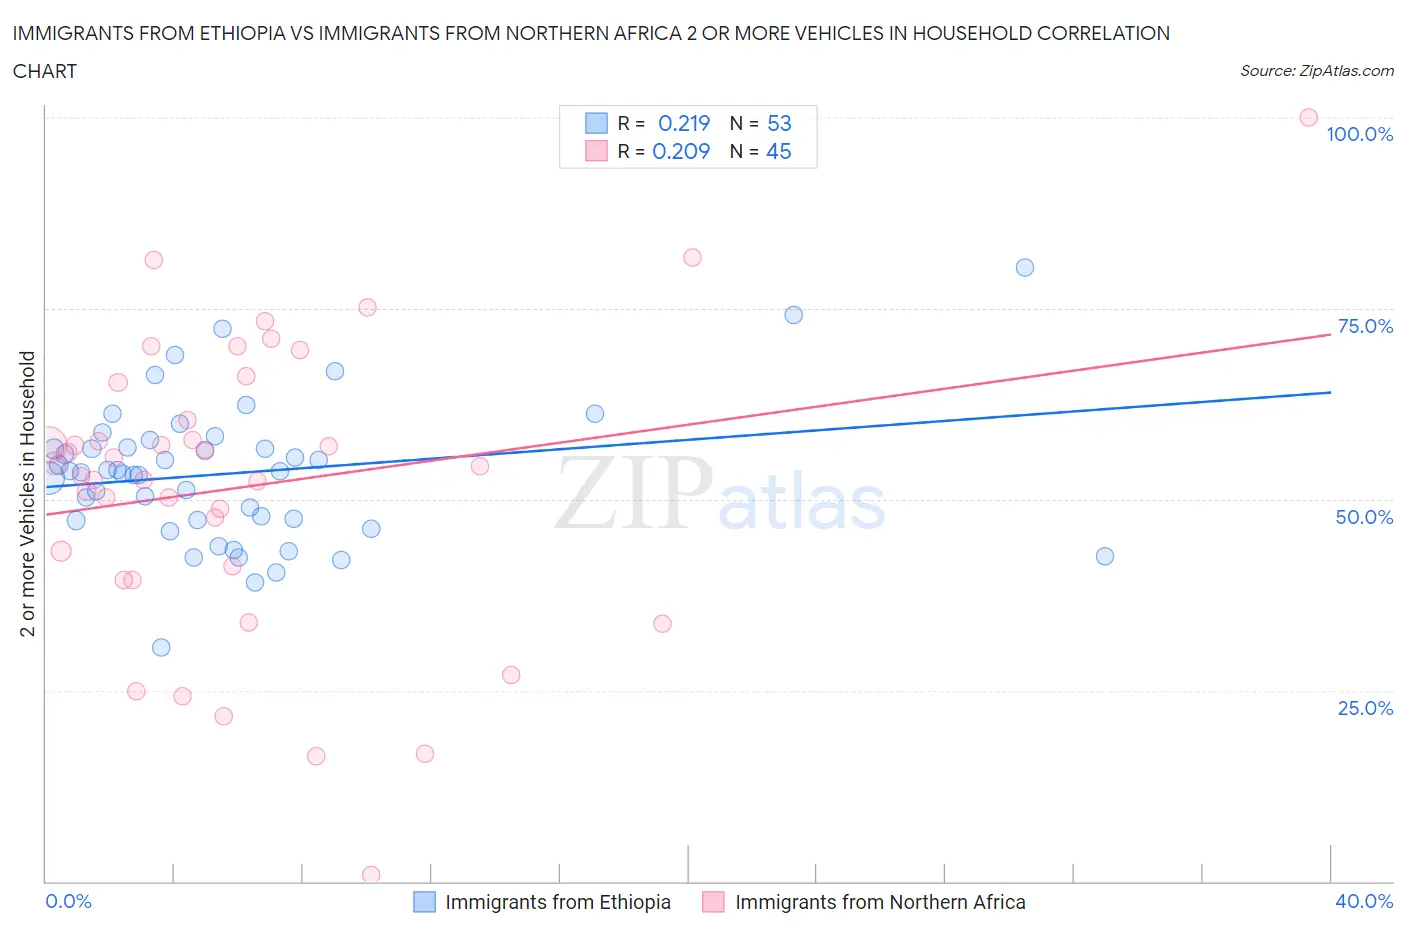
Immigrants from Ethiopia vs Immigrants from Northern Africa 2 or more Vehicles in Household Correlation Chart
The statistical analysis conducted on geographies consisting of 211,485,366 people shows a weak positive correlation between the proportion of Immigrants from Ethiopia and percentage of households with 2 or more vehicles available in the United States with a correlation coefficient (R) of 0.219 and weighted average of 53.0%. Similarly, the statistical analysis conducted on geographies consisting of 321,098,836 people shows a weak positive correlation between the proportion of Immigrants from Northern Africa and percentage of households with 2 or more vehicles available in the United States with a correlation coefficient (R) of 0.209 and weighted average of 52.3%, a difference of 1.3%.
2 or more Vehicles in Household Correlation Summary
| Measurement | Immigrants from Ethiopia | Immigrants from Northern Africa |
| Minimum | 30.6% | 0.83% |
| Maximum | 80.4% | 100.0% |
| Range | 49.7% | 99.2% |
| Mean | 53.4% | 51.7% |
| Median | 53.7% | 54.3% |
| Interquartile 25% (IQ1) | 47.3% | 40.4% |
| Interquartile 75% (IQ3) | 57.3% | 62.8% |
| Interquartile Range (IQR) | 10.0% | 22.4% |
| Standard Deviation (Sample) | 9.3% | 19.3% |
| Standard Deviation (Population) | 9.2% | 19.1% |
Demographics Similar to Immigrants from Ethiopia and Immigrants from Northern Africa by 2 or more Vehicles in Household
In terms of 2 or more vehicles in household, the demographic groups most similar to Immigrants from Ethiopia are Indian (Asian) (53.1%, a difference of 0.12%), Ethiopian (53.1%, a difference of 0.16%), Immigrants from Nigeria (52.9%, a difference of 0.20%), Sierra Leonean (52.9%, a difference of 0.22%), and Colombian (52.9%, a difference of 0.35%). Similarly, the demographic groups most similar to Immigrants from Northern Africa are Immigrants from Southern Europe (52.3%, a difference of 0.13%), Immigrants from Australia (52.4%, a difference of 0.20%), Immigrants from Bahamas (52.5%, a difference of 0.23%), Alsatian (52.5%, a difference of 0.30%), and Central American Indian (52.5%, a difference of 0.34%).
| Demographics | Rating | Rank | 2 or more Vehicles in Household |
| Ethiopians | 1.7 /100 | #243 | Tragic 53.1% |
| Indians (Asian) | 1.7 /100 | #244 | Tragic 53.1% |
| Immigrants | Ethiopia | 1.5 /100 | #245 | Tragic 53.0% |
| Immigrants | Nigeria | 1.2 /100 | #246 | Tragic 52.9% |
| Sierra Leoneans | 1.2 /100 | #247 | Tragic 52.9% |
| Colombians | 1.1 /100 | #248 | Tragic 52.9% |
| Immigrants | Brazil | 1.0 /100 | #249 | Tragic 52.8% |
| Mongolians | 1.0 /100 | #250 | Tragic 52.8% |
| Immigrants | Sudan | 1.0 /100 | #251 | Tragic 52.8% |
| Immigrants | Portugal | 1.0 /100 | #252 | Tragic 52.8% |
| Nigerians | 0.9 /100 | #253 | Tragic 52.8% |
| Immigrants | Malaysia | 0.8 /100 | #254 | Tragic 52.7% |
| Uruguayans | 0.7 /100 | #255 | Tragic 52.7% |
| Immigrants | Eritrea | 0.7 /100 | #256 | Tragic 52.6% |
| Immigrants | Hong Kong | 0.6 /100 | #257 | Tragic 52.6% |
| Central American Indians | 0.6 /100 | #258 | Tragic 52.5% |
| Alsatians | 0.6 /100 | #259 | Tragic 52.5% |
| Immigrants | Bahamas | 0.5 /100 | #260 | Tragic 52.5% |
| Immigrants | Australia | 0.5 /100 | #261 | Tragic 52.4% |
| Immigrants | Northern Africa | 0.4 /100 | #262 | Tragic 52.3% |
| Immigrants | Southern Europe | 0.4 /100 | #263 | Tragic 52.3% |