Afghan vs German No Vehicles in Household
COMPARE
Afghan
German
No Vehicles in Household
No Vehicles in Household Comparison
Afghans
Germans
8.0%
NO VEHICLES IN HOUSEHOLD
99.9/ 100
METRIC RATING
48th/ 347
METRIC RANK
6.7%
NO VEHICLES IN HOUSEHOLD
100.0/ 100
METRIC RATING
6th/ 347
METRIC RANK
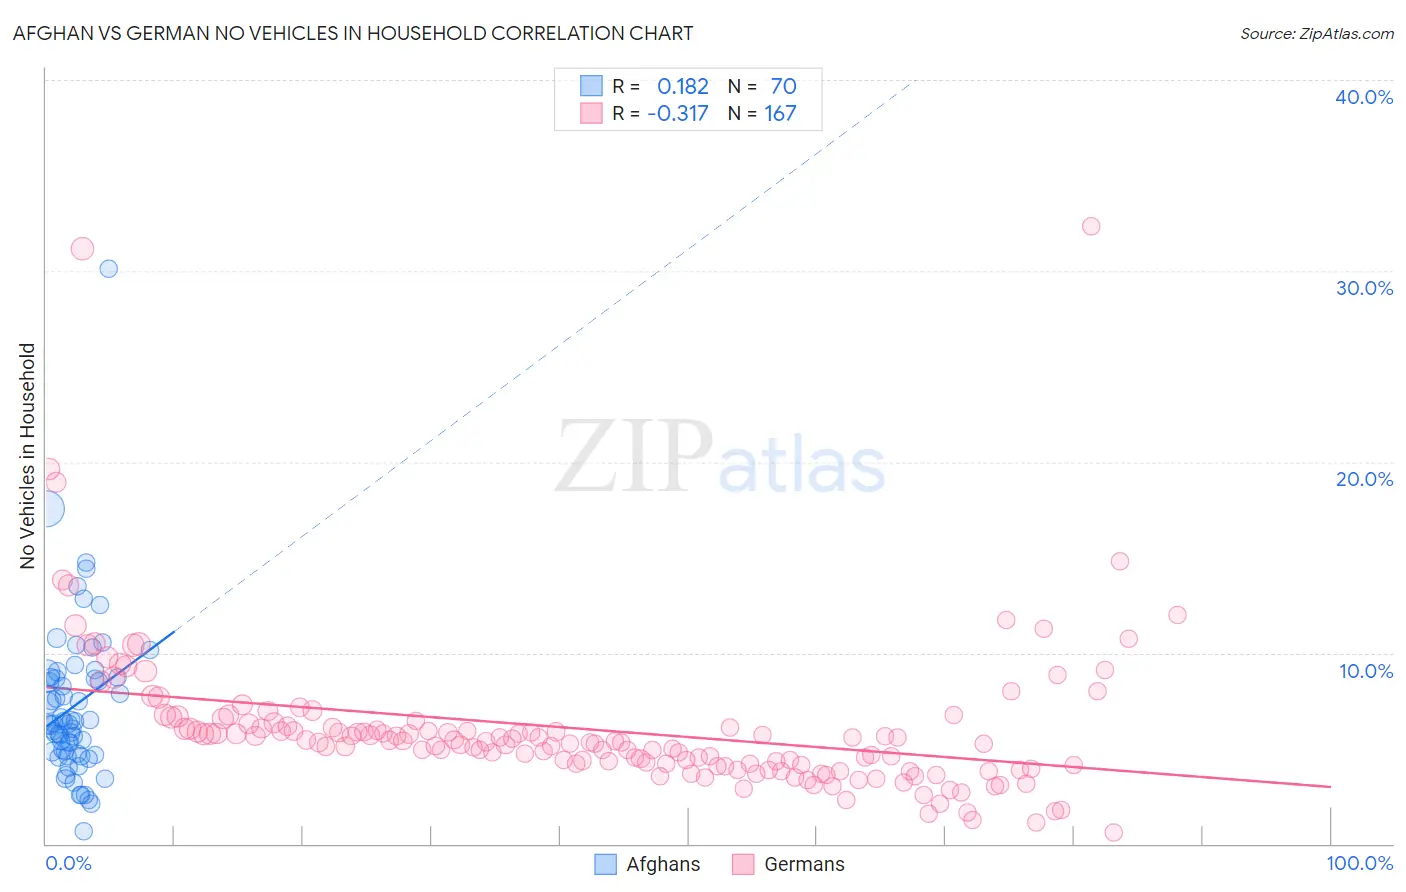
Afghan vs German No Vehicles in Household Correlation Chart
The statistical analysis conducted on geographies consisting of 148,777,308 people shows a poor positive correlation between the proportion of Afghans and percentage of households with no vehicle available in the United States with a correlation coefficient (R) of 0.182 and weighted average of 8.0%. Similarly, the statistical analysis conducted on geographies consisting of 573,819,115 people shows a mild negative correlation between the proportion of Germans and percentage of households with no vehicle available in the United States with a correlation coefficient (R) of -0.317 and weighted average of 6.7%, a difference of 19.4%.
No Vehicles in Household Correlation Summary
| Measurement | Afghan | German |
| Minimum | 0.64% | 0.56% |
| Maximum | 30.1% | 32.3% |
| Range | 29.5% | 31.8% |
| Mean | 7.2% | 6.0% |
| Median | 6.3% | 5.3% |
| Interquartile 25% (IQ1) | 4.7% | 4.1% |
| Interquartile 75% (IQ3) | 8.7% | 6.1% |
| Interquartile Range (IQR) | 4.0% | 2.0% |
| Standard Deviation (Sample) | 4.3% | 4.0% |
| Standard Deviation (Population) | 4.2% | 4.0% |
Similar Demographics by No Vehicles in Household
Demographics Similar to Afghans by No Vehicles in Household
In terms of no vehicles in household, the demographic groups most similar to Afghans are Guamanian/Chamorro (8.0%, a difference of 0.17%), Belgian (8.0%, a difference of 0.25%), Korean (8.0%, a difference of 0.34%), Northern European (7.9%, a difference of 0.47%), and Spanish (7.9%, a difference of 0.59%).
| Demographics | Rating | Rank | No Vehicles in Household |
| French Canadians | 99.9 /100 | #41 | Exceptional 7.8% |
| Swiss | 99.9 /100 | #42 | Exceptional 7.9% |
| Chickasaw | 99.9 /100 | #43 | Exceptional 7.9% |
| Choctaw | 99.9 /100 | #44 | Exceptional 7.9% |
| Immigrants | Nonimmigrants | 99.9 /100 | #45 | Exceptional 7.9% |
| Spanish | 99.9 /100 | #46 | Exceptional 7.9% |
| Northern Europeans | 99.9 /100 | #47 | Exceptional 7.9% |
| Afghans | 99.9 /100 | #48 | Exceptional 8.0% |
| Guamanians/Chamorros | 99.9 /100 | #49 | Exceptional 8.0% |
| Belgians | 99.9 /100 | #50 | Exceptional 8.0% |
| Koreans | 99.9 /100 | #51 | Exceptional 8.0% |
| Hawaiians | 99.9 /100 | #52 | Exceptional 8.0% |
| Slovenes | 99.9 /100 | #53 | Exceptional 8.0% |
| Immigrants | Venezuela | 99.9 /100 | #54 | Exceptional 8.1% |
| Celtics | 99.9 /100 | #55 | Exceptional 8.1% |
Demographics Similar to Germans by No Vehicles in Household
In terms of no vehicles in household, the demographic groups most similar to Germans are Yakama (6.6%, a difference of 0.99%), Scottish (6.8%, a difference of 1.3%), Danish (6.6%, a difference of 1.3%), Swedish (6.8%, a difference of 1.8%), and Scotch-Irish (6.8%, a difference of 2.0%).
| Demographics | Rating | Rank | No Vehicles in Household |
| Luxembourgers | 100.0 /100 | #1 | Exceptional 5.4% |
| Norwegians | 100.0 /100 | #2 | Exceptional 6.4% |
| English | 100.0 /100 | #3 | Exceptional 6.5% |
| Danes | 100.0 /100 | #4 | Exceptional 6.6% |
| Yakama | 100.0 /100 | #5 | Exceptional 6.6% |
| Germans | 100.0 /100 | #6 | Exceptional 6.7% |
| Scottish | 100.0 /100 | #7 | Exceptional 6.8% |
| Swedes | 100.0 /100 | #8 | Exceptional 6.8% |
| Scotch-Irish | 100.0 /100 | #9 | Exceptional 6.8% |
| Dutch | 100.0 /100 | #10 | Exceptional 6.8% |
| Czechs | 100.0 /100 | #11 | Exceptional 6.9% |
| Assyrians/Chaldeans/Syriacs | 100.0 /100 | #12 | Exceptional 7.0% |
| Scandinavians | 100.0 /100 | #13 | Exceptional 7.0% |
| Mexicans | 100.0 /100 | #14 | Exceptional 7.0% |
| Whites/Caucasians | 100.0 /100 | #15 | Exceptional 7.0% |