Zip Codes with the Highest Percentage of Population Employed in Security & Protection in Portsmouth, VA
RELATED REPORTS & OPTIONS
Security & Protection
Portsmouth
Compare Zip Codes
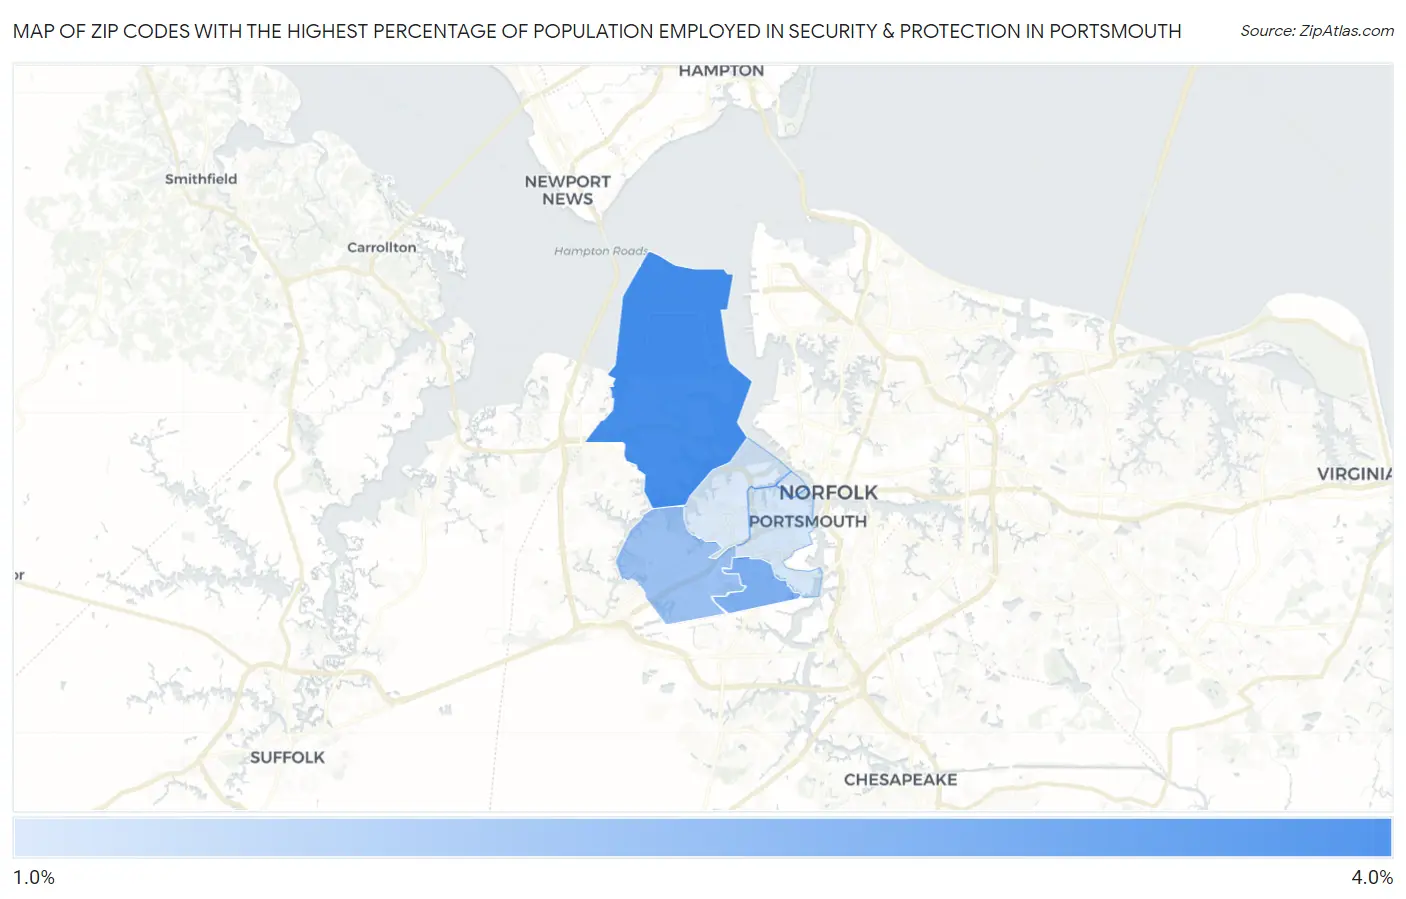
Map of Zip Codes with the Highest Percentage of Population Employed in Security & Protection in Portsmouth
1.7%
3.1%
Zip Codes with the Highest Percentage of Population Employed in Security & Protection in Portsmouth, VA
| Zip Code | % Employed | vs State | vs National | |
| 1. | 23703 | 3.1% | 2.7%(+0.408)#283 | 2.1%(+0.942)#6,918 |
| 2. | 23702 | 2.6% | 2.7%(-0.109)#357 | 2.1%(+0.425)#9,133 |
| 3. | 23701 | 2.3% | 2.7%(-0.395)#394 | 2.1%(+0.139)#10,724 |
| 4. | 23704 | 1.7% | 2.7%(-0.936)#486 | 2.1%(-0.402)#14,338 |
| 5. | 23707 | 1.7% | 2.7%(-0.993)#495 | 2.1%(-0.459)#14,764 |
1
Common Questions
What are the Top 5 Zip Codes with the Highest Percentage of Population Employed in Security & Protection in Portsmouth, VA?
Top 5 Zip Codes with the Highest Percentage of Population Employed in Security & Protection in Portsmouth, VA are:
What zip code has the Highest Percentage of Population Employed in Security & Protection in Portsmouth, VA?
23703 has the Highest Percentage of Population Employed in Security & Protection in Portsmouth, VA with 3.1%.
What is the Percentage of Population Employed in Security & Protection in Portsmouth, VA?
Percentage of Population Employed in Security & Protection in Portsmouth is 2.4%.
What is the Percentage of Population Employed in Security & Protection in Virginia?
Percentage of Population Employed in Security & Protection in Virginia is 2.7%.
What is the Percentage of Population Employed in Security & Protection in the United States?
Percentage of Population Employed in Security & Protection in the United States is 2.1%.