Zip Codes with the Highest Percentage of Population Employed in Office & Administration in Chesterfield, VA
RELATED REPORTS & OPTIONS
Office & Administration
Chesterfield
Compare Zip Codes
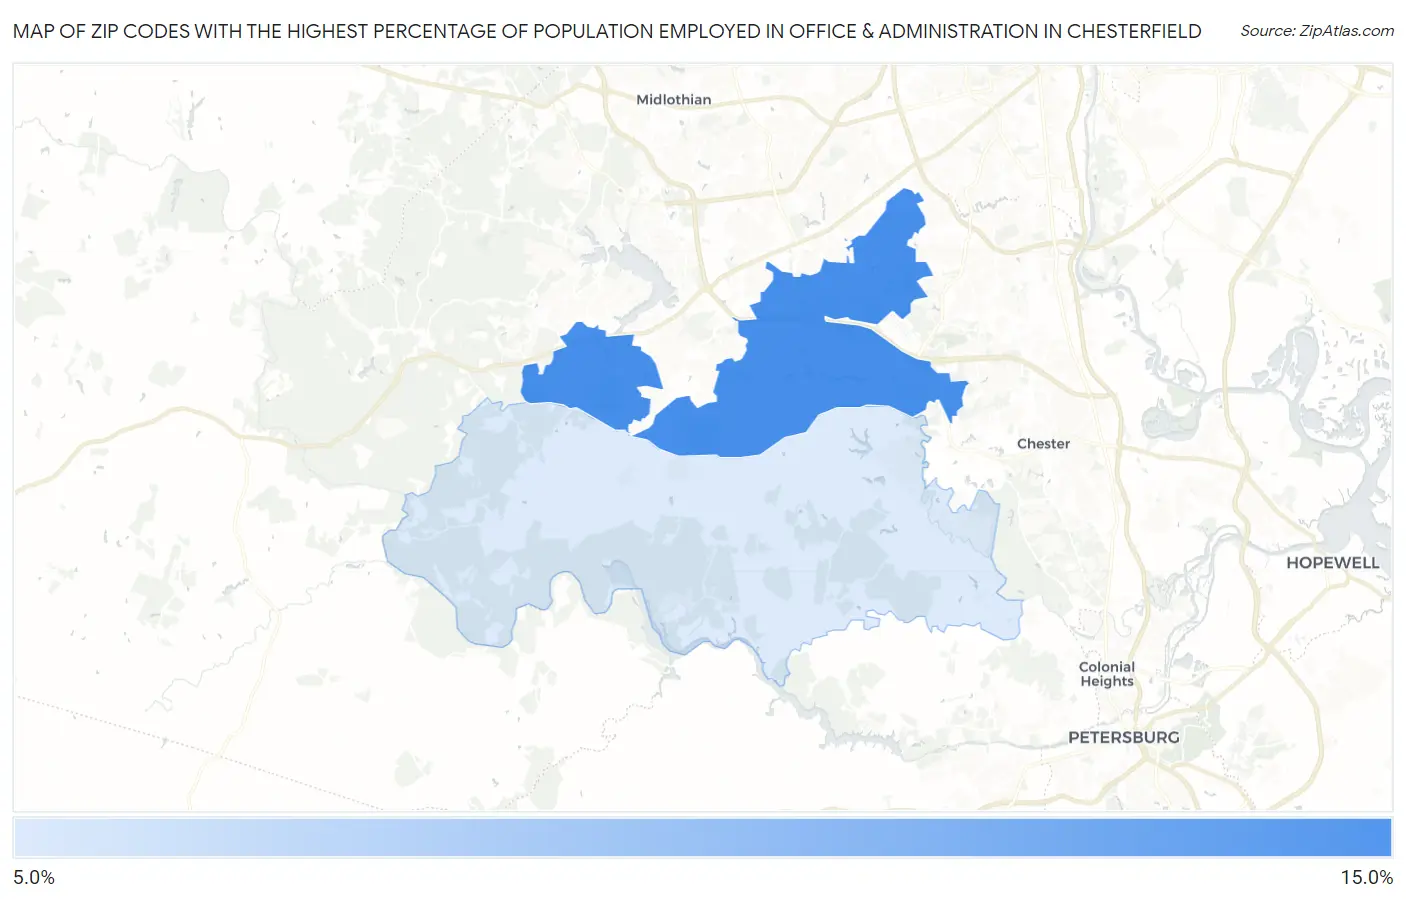
Map of Zip Codes with the Highest Percentage of Population Employed in Office & Administration in Chesterfield
9.7%
12.6%
Zip Codes with the Highest Percentage of Population Employed in Office & Administration in Chesterfield, VA
| Zip Code | % Employed | vs State | vs National | |
| 1. | 23832 | 12.6% | 10.0%(+2.63)#214 | 10.9%(+1.76)#9,004 |
| 2. | 23838 | 9.7% | 10.0%(-0.264)#417 | 10.9%(-1.13)#17,992 |
1
Common Questions
What are the Top Zip Codes with the Highest Percentage of Population Employed in Office & Administration in Chesterfield, VA?
Top Zip Codes with the Highest Percentage of Population Employed in Office & Administration in Chesterfield, VA are:
What zip code has the Highest Percentage of Population Employed in Office & Administration in Chesterfield, VA?
23832 has the Highest Percentage of Population Employed in Office & Administration in Chesterfield, VA with 12.6%.
What is the Percentage of Population Employed in Office & Administration in Virginia?
Percentage of Population Employed in Office & Administration in Virginia is 10.0%.
What is the Percentage of Population Employed in Office & Administration in the United States?
Percentage of Population Employed in Office & Administration in the United States is 10.9%.