Zip Codes with the Highest Percentage of Population Employed in Architecture & Engineering in Cedar City, UT
RELATED REPORTS & OPTIONS
Architecture & Engineering
Cedar City
Compare Zip Codes
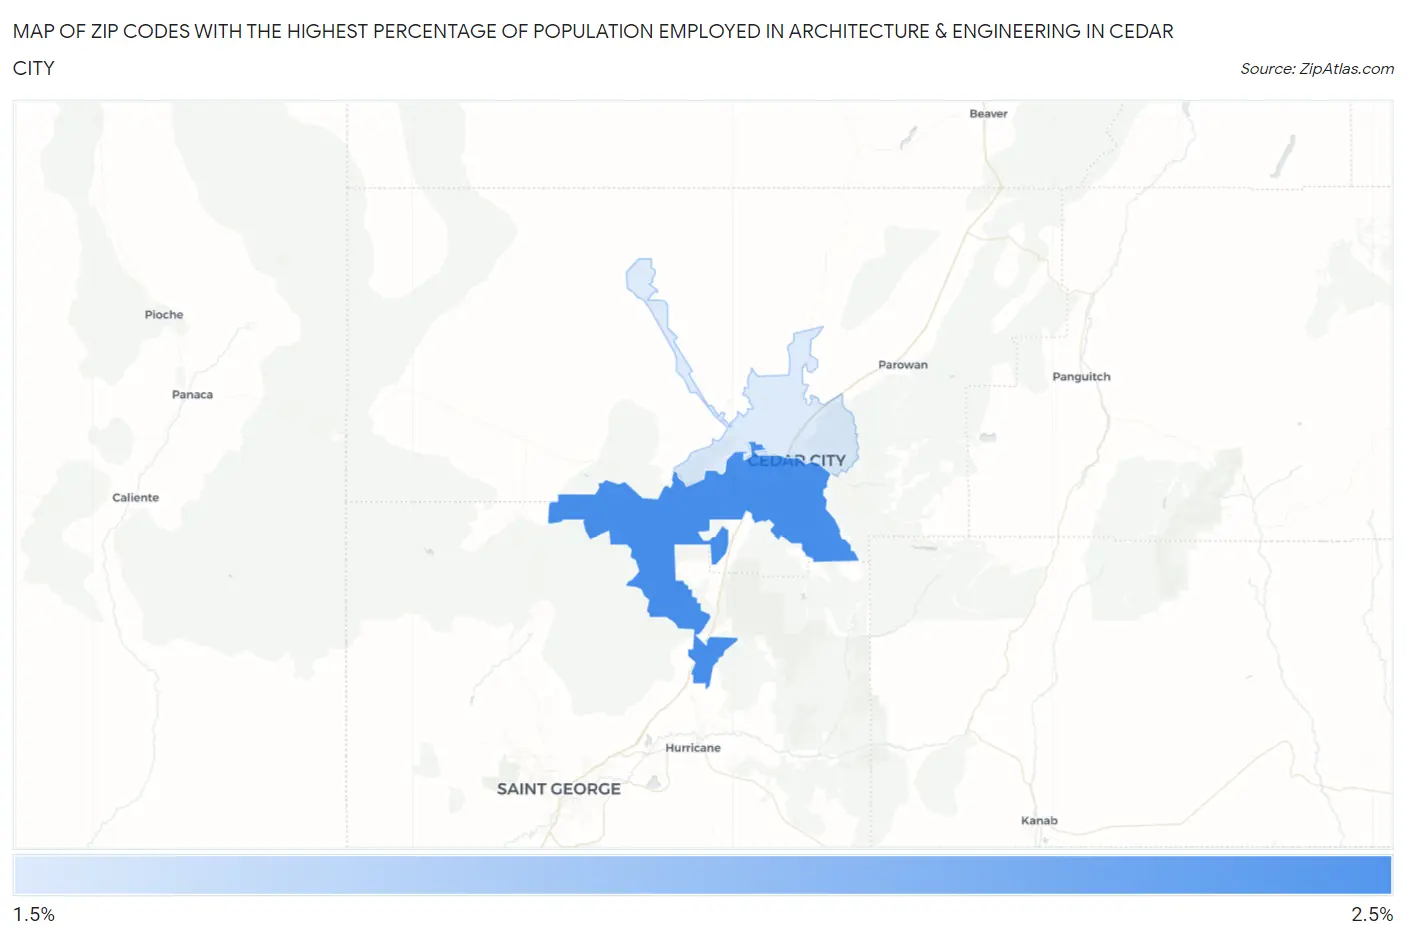
Map of Zip Codes with the Highest Percentage of Population Employed in Architecture & Engineering in Cedar City
1.8%
2.4%
Zip Codes with the Highest Percentage of Population Employed in Architecture & Engineering in Cedar City, UT
| Zip Code | % Employed | vs State | vs National | |
| 1. | 84720 | 2.4% | 2.2%(+0.280)#78 | 2.1%(+0.289)#7,292 |
| 2. | 84721 | 1.8% | 2.2%(-0.357)#114 | 2.1%(-0.348)#10,814 |
1
Common Questions
What are the Top Zip Codes with the Highest Percentage of Population Employed in Architecture & Engineering in Cedar City, UT?
Top Zip Codes with the Highest Percentage of Population Employed in Architecture & Engineering in Cedar City, UT are:
What zip code has the Highest Percentage of Population Employed in Architecture & Engineering in Cedar City, UT?
84720 has the Highest Percentage of Population Employed in Architecture & Engineering in Cedar City, UT with 2.4%.
What is the Percentage of Population Employed in Architecture & Engineering in Cedar City, UT?
Percentage of Population Employed in Architecture & Engineering in Cedar City is 2.2%.
What is the Percentage of Population Employed in Architecture & Engineering in Utah?
Percentage of Population Employed in Architecture & Engineering in Utah is 2.2%.
What is the Percentage of Population Employed in Architecture & Engineering in the United States?
Percentage of Population Employed in Architecture & Engineering in the United States is 2.1%.