Zip Codes with the Highest Percentage of Population Employed in Architecture & Engineering in Saint George, UT
RELATED REPORTS & OPTIONS
Architecture & Engineering
Saint George
Compare Zip Codes
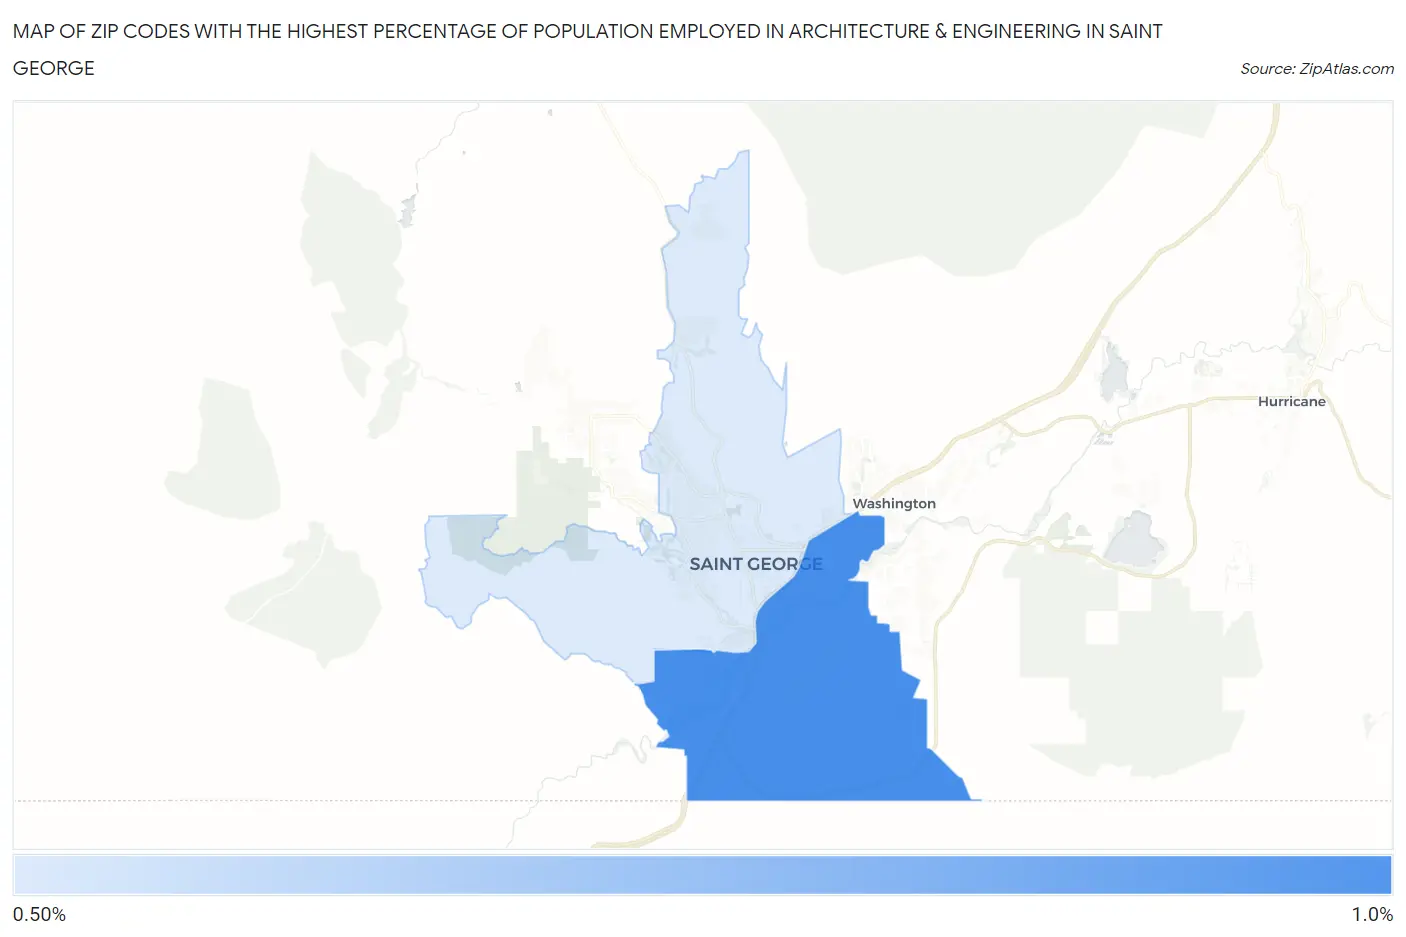
Map of Zip Codes with the Highest Percentage of Population Employed in Architecture & Engineering in Saint George
0.54%
0.85%
Zip Codes with the Highest Percentage of Population Employed in Architecture & Engineering in Saint George, UT
| Zip Code | % Employed | vs State | vs National | |
| 1. | 84790 | 0.85% | 2.2%(-1.31)#167 | 2.1%(-1.30)#17,772 |
| 2. | 84770 | 0.54% | 2.2%(-1.62)#180 | 2.1%(-1.61)#20,020 |
1
Common Questions
What are the Top Zip Codes with the Highest Percentage of Population Employed in Architecture & Engineering in Saint George, UT?
Top Zip Codes with the Highest Percentage of Population Employed in Architecture & Engineering in Saint George, UT are:
What zip code has the Highest Percentage of Population Employed in Architecture & Engineering in Saint George, UT?
84790 has the Highest Percentage of Population Employed in Architecture & Engineering in Saint George, UT with 0.85%.
What is the Percentage of Population Employed in Architecture & Engineering in Utah?
Percentage of Population Employed in Architecture & Engineering in Utah is 2.2%.
What is the Percentage of Population Employed in Architecture & Engineering in the United States?
Percentage of Population Employed in Architecture & Engineering in the United States is 2.1%.