Guatemalan vs Immigrants from Middle Africa Male Unemployment
COMPARE
Guatemalan
Immigrants from Middle Africa
Male Unemployment
Male Unemployment Comparison
Guatemalans
Immigrants from Middle Africa
5.6%
MALE UNEMPLOYMENT
1.2/ 100
METRIC RATING
236th/ 347
METRIC RANK
5.5%
MALE UNEMPLOYMENT
8.3/ 100
METRIC RATING
209th/ 347
METRIC RANK
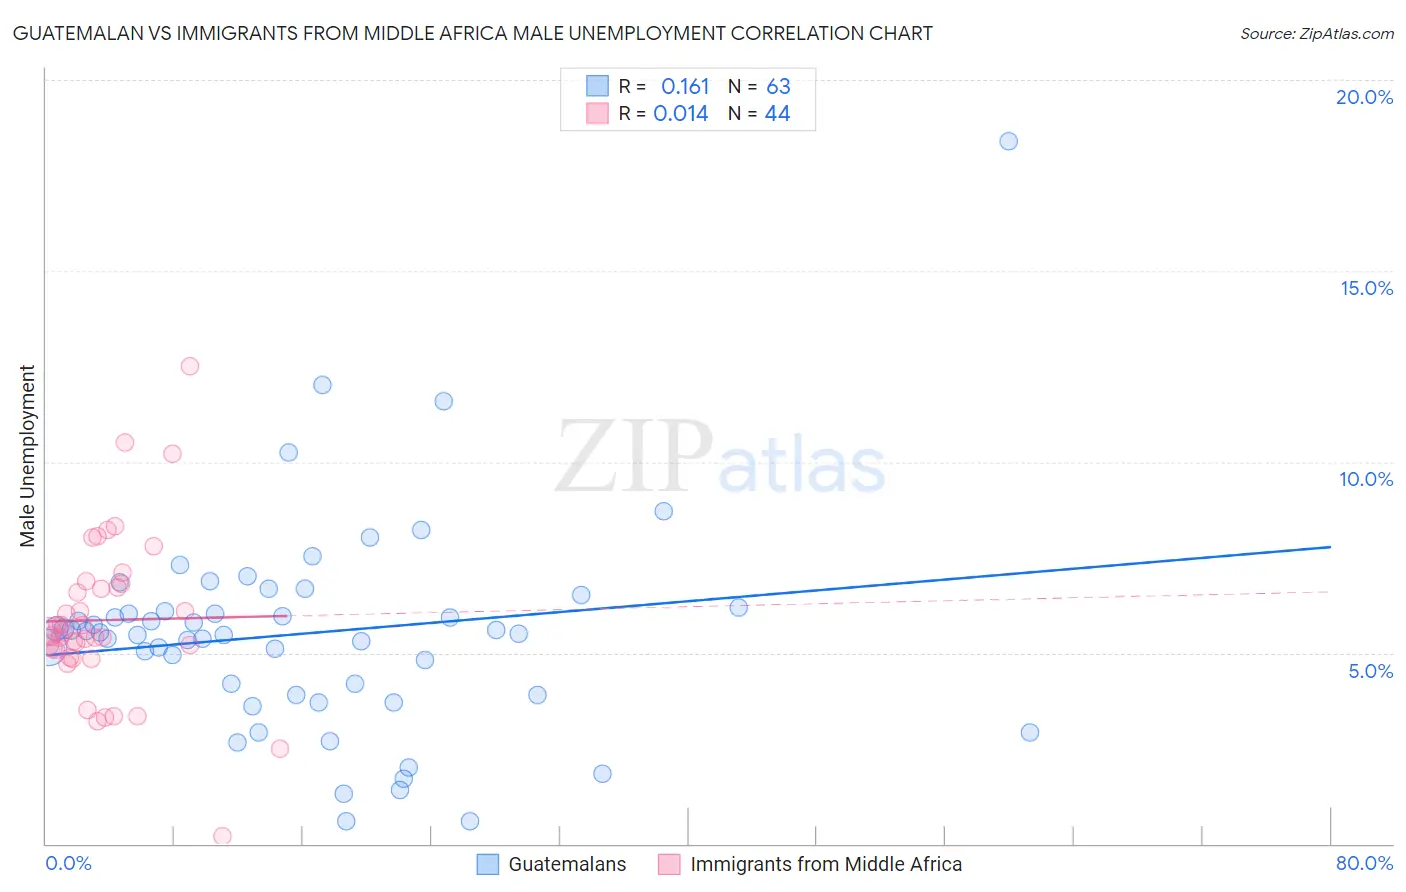
Guatemalan vs Immigrants from Middle Africa Male Unemployment Correlation Chart
The statistical analysis conducted on geographies consisting of 407,851,547 people shows a poor positive correlation between the proportion of Guatemalans and unemployment rate among males in the United States with a correlation coefficient (R) of 0.161 and weighted average of 5.6%. Similarly, the statistical analysis conducted on geographies consisting of 202,406,259 people shows no correlation between the proportion of Immigrants from Middle Africa and unemployment rate among males in the United States with a correlation coefficient (R) of 0.014 and weighted average of 5.5%, a difference of 2.8%.
Male Unemployment Correlation Summary
| Measurement | Guatemalan | Immigrants from Middle Africa |
| Minimum | 0.60% | 0.20% |
| Maximum | 18.4% | 12.5% |
| Range | 17.8% | 12.3% |
| Mean | 5.5% | 5.9% |
| Median | 5.5% | 5.5% |
| Interquartile 25% (IQ1) | 3.9% | 5.0% |
| Interquartile 75% (IQ3) | 6.2% | 6.8% |
| Interquartile Range (IQR) | 2.3% | 1.8% |
| Standard Deviation (Sample) | 2.8% | 2.1% |
| Standard Deviation (Population) | 2.8% | 2.1% |
Similar Demographics by Male Unemployment
Demographics Similar to Guatemalans by Male Unemployment
In terms of male unemployment, the demographic groups most similar to Guatemalans are Honduran (5.6%, a difference of 0.090%), Native Hawaiian (5.6%, a difference of 0.14%), Immigrants from Guatemala (5.6%, a difference of 0.14%), Immigrants from Cameroon (5.6%, a difference of 0.21%), and Salvadoran (5.7%, a difference of 0.25%).
| Demographics | Rating | Rank | Male Unemployment |
| Central Americans | 1.8 /100 | #229 | Tragic 5.6% |
| Immigrants | Africa | 1.7 /100 | #230 | Tragic 5.6% |
| Choctaw | 1.6 /100 | #231 | Tragic 5.6% |
| Moroccans | 1.6 /100 | #232 | Tragic 5.6% |
| Somalis | 1.5 /100 | #233 | Tragic 5.6% |
| Immigrants | Somalia | 1.5 /100 | #234 | Tragic 5.6% |
| Immigrants | Honduras | 1.5 /100 | #235 | Tragic 5.6% |
| Guatemalans | 1.2 /100 | #236 | Tragic 5.6% |
| Hondurans | 1.1 /100 | #237 | Tragic 5.6% |
| Native Hawaiians | 1.1 /100 | #238 | Tragic 5.6% |
| Immigrants | Guatemala | 1.1 /100 | #239 | Tragic 5.6% |
| Immigrants | Cameroon | 1.0 /100 | #240 | Tragic 5.6% |
| Salvadorans | 1.0 /100 | #241 | Tragic 5.7% |
| Ottawa | 0.9 /100 | #242 | Tragic 5.7% |
| Bangladeshis | 0.8 /100 | #243 | Tragic 5.7% |
Demographics Similar to Immigrants from Middle Africa by Male Unemployment
In terms of male unemployment, the demographic groups most similar to Immigrants from Middle Africa are Immigrants from Lebanon (5.5%, a difference of 0.050%), South American Indian (5.5%, a difference of 0.13%), Israeli (5.5%, a difference of 0.17%), Immigrants from Syria (5.5%, a difference of 0.18%), and Hmong (5.5%, a difference of 0.27%).
| Demographics | Rating | Rank | Male Unemployment |
| Immigrants | Nonimmigrants | 13.1 /100 | #202 | Poor 5.4% |
| Immigrants | Laos | 13.0 /100 | #203 | Poor 5.4% |
| Guamanians/Chamorros | 12.3 /100 | #204 | Poor 5.4% |
| Immigrants | Costa Rica | 11.4 /100 | #205 | Poor 5.5% |
| Immigrants | Ukraine | 9.9 /100 | #206 | Tragic 5.5% |
| Immigrants | Syria | 9.3 /100 | #207 | Tragic 5.5% |
| Immigrants | Lebanon | 8.6 /100 | #208 | Tragic 5.5% |
| Immigrants | Middle Africa | 8.3 /100 | #209 | Tragic 5.5% |
| South American Indians | 7.6 /100 | #210 | Tragic 5.5% |
| Israelis | 7.4 /100 | #211 | Tragic 5.5% |
| Hmong | 7.0 /100 | #212 | Tragic 5.5% |
| Ugandans | 6.3 /100 | #213 | Tragic 5.5% |
| Puget Sound Salish | 5.6 /100 | #214 | Tragic 5.5% |
| Samoans | 4.9 /100 | #215 | Tragic 5.5% |
| Immigrants | Immigrants | 4.3 /100 | #216 | Tragic 5.5% |