White/Caucasian vs Guyanese Unemployment Among Seniors over 65 years
COMPARE
White/Caucasian
Guyanese
Unemployment Among Seniors over 65 years
Unemployment Among Seniors over 65 years Comparison
Whites/Caucasians
Guyanese
5.1%
UNEMPLOYMENT AMONG SENIORS OVER 65 YEARS
84.4/ 100
METRIC RATING
136th/ 347
METRIC RANK
5.6%
UNEMPLOYMENT AMONG SENIORS OVER 65 YEARS
0.0/ 100
METRIC RATING
299th/ 347
METRIC RANK
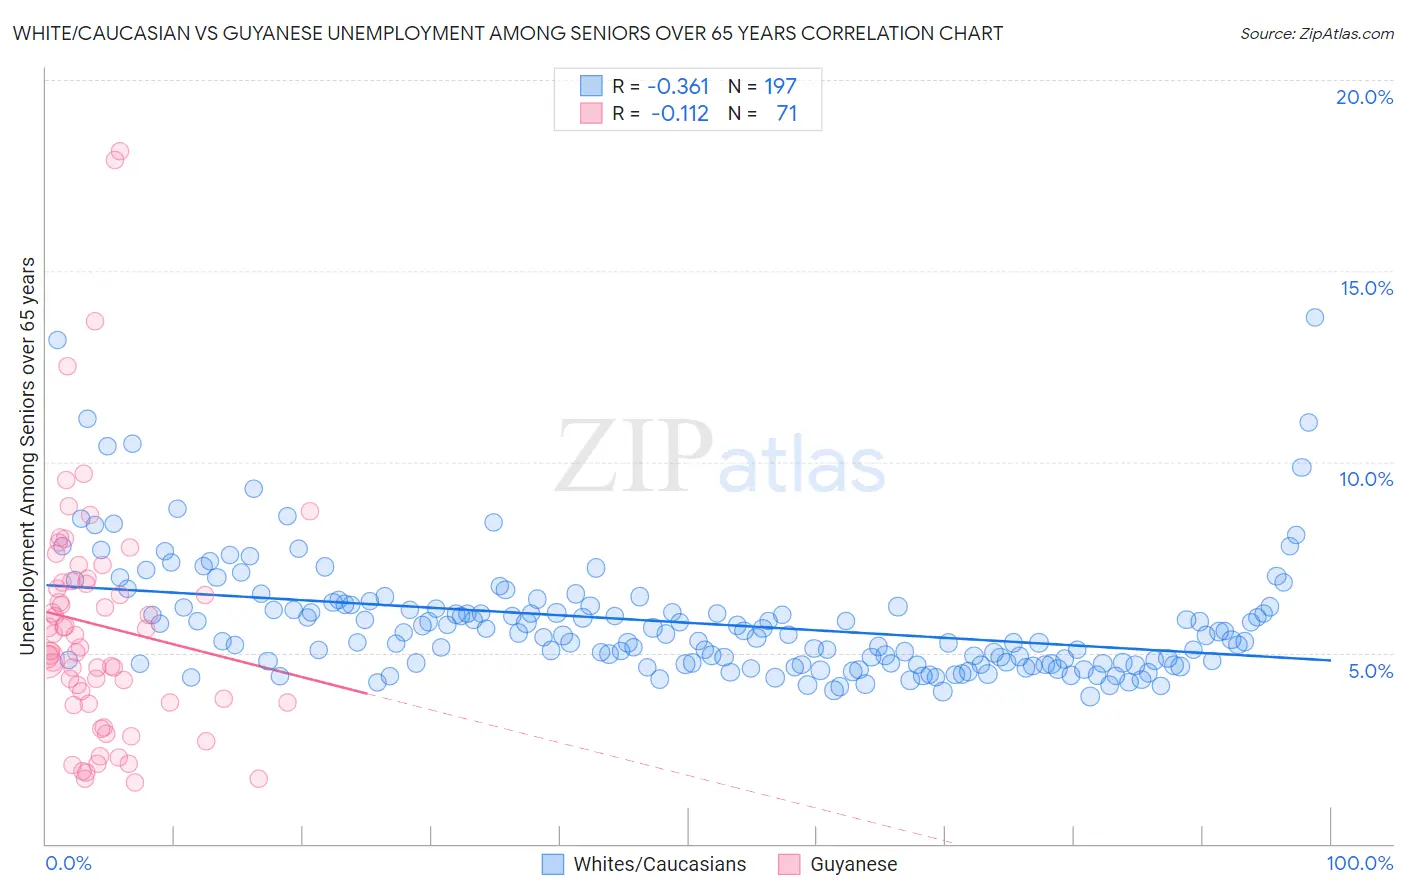
White/Caucasian vs Guyanese Unemployment Among Seniors over 65 years Correlation Chart
The statistical analysis conducted on geographies consisting of 465,209,584 people shows a mild negative correlation between the proportion of Whites/Caucasians and unemployment rate amomg seniors over the age of 65 in the United States with a correlation coefficient (R) of -0.361 and weighted average of 5.1%. Similarly, the statistical analysis conducted on geographies consisting of 168,241,016 people shows a poor negative correlation between the proportion of Guyanese and unemployment rate amomg seniors over the age of 65 in the United States with a correlation coefficient (R) of -0.112 and weighted average of 5.6%, a difference of 9.5%.
Unemployment Among Seniors over 65 years Correlation Summary
| Measurement | White/Caucasian | Guyanese |
| Minimum | 3.9% | 1.6% |
| Maximum | 13.8% | 18.1% |
| Range | 9.9% | 16.5% |
| Mean | 5.8% | 5.7% |
| Median | 5.5% | 5.1% |
| Interquartile 25% (IQ1) | 4.7% | 3.7% |
| Interquartile 75% (IQ3) | 6.2% | 6.9% |
| Interquartile Range (IQR) | 1.5% | 3.2% |
| Standard Deviation (Sample) | 1.6% | 3.2% |
| Standard Deviation (Population) | 1.6% | 3.2% |
Similar Demographics by Unemployment Among Seniors over 65 years
Demographics Similar to Whites/Caucasians by Unemployment Among Seniors over 65 years
In terms of unemployment among seniors over 65 years, the demographic groups most similar to Whites/Caucasians are Ukrainian (5.1%, a difference of 0.0%), Arab (5.1%, a difference of 0.0%), Turkish (5.1%, a difference of 0.030%), Syrian (5.1%, a difference of 0.060%), and New Zealander (5.1%, a difference of 0.070%).
| Demographics | Rating | Rank | Unemployment Among Seniors over 65 years |
| Immigrants | England | 86.7 /100 | #129 | Excellent 5.1% |
| Iranians | 86.6 /100 | #130 | Excellent 5.1% |
| Immigrants | Australia | 85.8 /100 | #131 | Excellent 5.1% |
| Chileans | 85.6 /100 | #132 | Excellent 5.1% |
| Syrians | 85.3 /100 | #133 | Excellent 5.1% |
| Turks | 84.9 /100 | #134 | Excellent 5.1% |
| Ukrainians | 84.4 /100 | #135 | Excellent 5.1% |
| Whites/Caucasians | 84.4 /100 | #136 | Excellent 5.1% |
| Arabs | 84.3 /100 | #137 | Excellent 5.1% |
| New Zealanders | 83.2 /100 | #138 | Excellent 5.1% |
| Immigrants | Panama | 83.0 /100 | #139 | Excellent 5.1% |
| Immigrants | Chile | 83.0 /100 | #140 | Excellent 5.1% |
| Cherokee | 81.6 /100 | #141 | Excellent 5.1% |
| Immigrants | Indonesia | 81.0 /100 | #142 | Excellent 5.1% |
| Senegalese | 80.4 /100 | #143 | Excellent 5.1% |
Demographics Similar to Guyanese by Unemployment Among Seniors over 65 years
In terms of unemployment among seniors over 65 years, the demographic groups most similar to Guyanese are Zimbabwean (5.6%, a difference of 0.050%), Immigrants from West Indies (5.6%, a difference of 0.090%), Yaqui (5.5%, a difference of 0.21%), Cheyenne (5.5%, a difference of 0.22%), and Cape Verdean (5.5%, a difference of 0.22%).
| Demographics | Rating | Rank | Unemployment Among Seniors over 65 years |
| Belizeans | 0.0 /100 | #292 | Tragic 5.5% |
| Immigrants | Venezuela | 0.0 /100 | #293 | Tragic 5.5% |
| Armenians | 0.0 /100 | #294 | Tragic 5.5% |
| Cheyenne | 0.0 /100 | #295 | Tragic 5.5% |
| Cape Verdeans | 0.0 /100 | #296 | Tragic 5.5% |
| Yaqui | 0.0 /100 | #297 | Tragic 5.5% |
| Immigrants | West Indies | 0.0 /100 | #298 | Tragic 5.6% |
| Guyanese | 0.0 /100 | #299 | Tragic 5.6% |
| Zimbabweans | 0.0 /100 | #300 | Tragic 5.6% |
| Hispanics or Latinos | 0.0 /100 | #301 | Tragic 5.6% |
| Guatemalans | 0.0 /100 | #302 | Tragic 5.6% |
| Immigrants | Latin America | 0.0 /100 | #303 | Tragic 5.6% |
| Liberians | 0.0 /100 | #304 | Tragic 5.6% |
| Mexicans | 0.0 /100 | #305 | Tragic 5.6% |
| Ecuadorians | 0.0 /100 | #306 | Tragic 5.6% |