Guamanian/Chamorro vs Guyanese Unemployment Among Seniors over 65 years
COMPARE
Guamanian/Chamorro
Guyanese
Unemployment Among Seniors over 65 years
Unemployment Among Seniors over 65 years Comparison
Guamanians/Chamorros
Guyanese
5.2%
UNEMPLOYMENT AMONG SENIORS OVER 65 YEARS
22.5/ 100
METRIC RATING
197th/ 347
METRIC RANK
5.6%
UNEMPLOYMENT AMONG SENIORS OVER 65 YEARS
0.0/ 100
METRIC RATING
299th/ 347
METRIC RANK
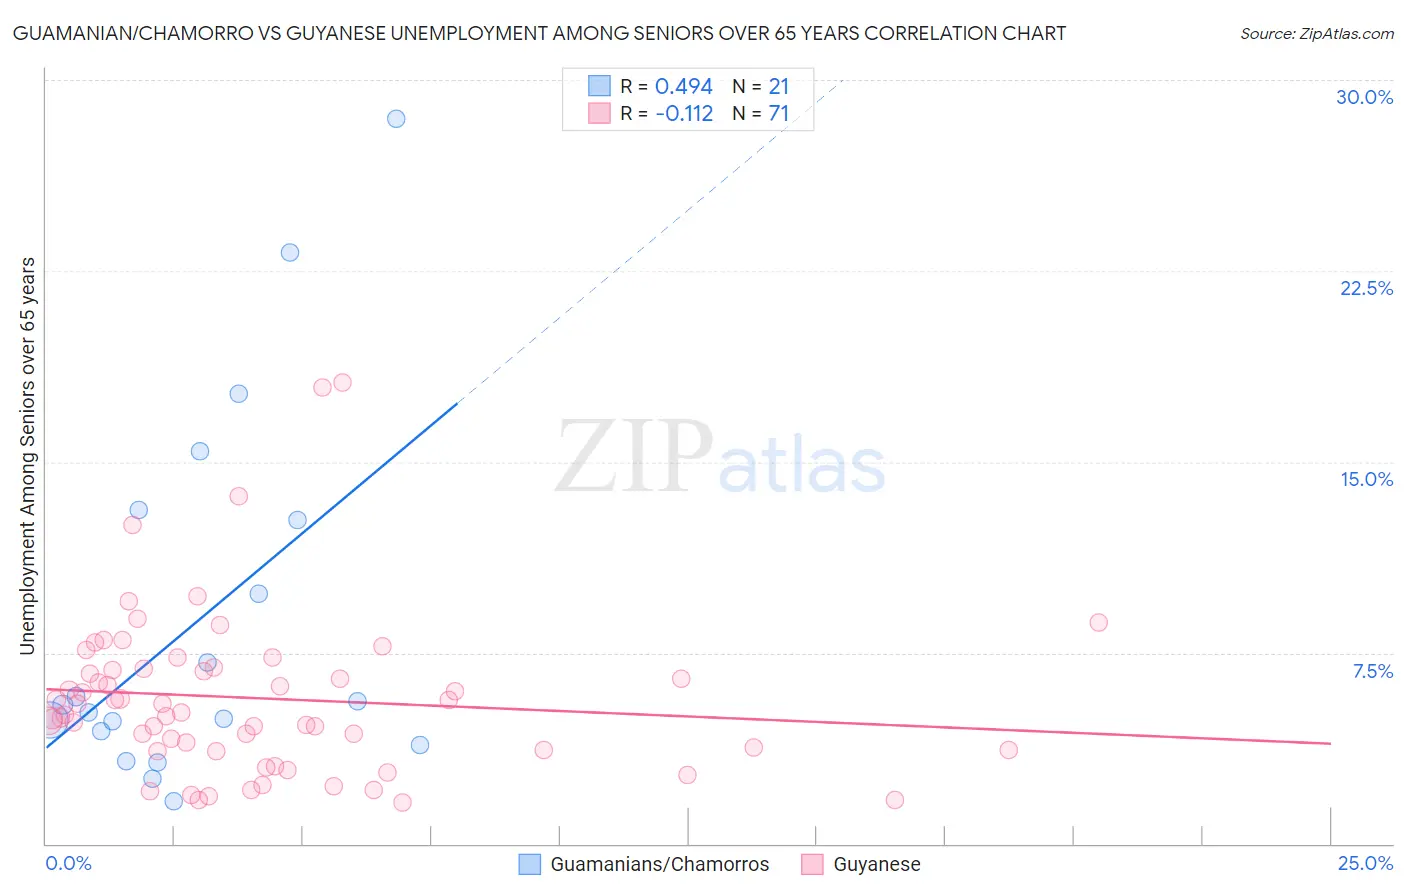
Guamanian/Chamorro vs Guyanese Unemployment Among Seniors over 65 years Correlation Chart
The statistical analysis conducted on geographies consisting of 208,240,219 people shows a moderate positive correlation between the proportion of Guamanians/Chamorros and unemployment rate amomg seniors over the age of 65 in the United States with a correlation coefficient (R) of 0.494 and weighted average of 5.2%. Similarly, the statistical analysis conducted on geographies consisting of 168,241,016 people shows a poor negative correlation between the proportion of Guyanese and unemployment rate amomg seniors over the age of 65 in the United States with a correlation coefficient (R) of -0.112 and weighted average of 5.6%, a difference of 6.9%.
Unemployment Among Seniors over 65 years Correlation Summary
| Measurement | Guamanian/Chamorro | Guyanese |
| Minimum | 1.7% | 1.6% |
| Maximum | 28.5% | 18.1% |
| Range | 26.8% | 16.5% |
| Mean | 8.7% | 5.7% |
| Median | 5.5% | 5.1% |
| Interquartile 25% (IQ1) | 4.2% | 3.7% |
| Interquartile 75% (IQ3) | 12.9% | 6.9% |
| Interquartile Range (IQR) | 8.8% | 3.2% |
| Standard Deviation (Sample) | 7.2% | 3.2% |
| Standard Deviation (Population) | 7.0% | 3.2% |
Similar Demographics by Unemployment Among Seniors over 65 years
Demographics Similar to Guamanians/Chamorros by Unemployment Among Seniors over 65 years
In terms of unemployment among seniors over 65 years, the demographic groups most similar to Guamanians/Chamorros are Immigrants from Poland (5.2%, a difference of 0.080%), Maltese (5.2%, a difference of 0.14%), Immigrants from Europe (5.2%, a difference of 0.17%), Costa Rican (5.2%, a difference of 0.19%), and Immigrants from Pakistan (5.2%, a difference of 0.20%).
| Demographics | Rating | Rank | Unemployment Among Seniors over 65 years |
| Koreans | 31.6 /100 | #190 | Fair 5.2% |
| Immigrants | Denmark | 31.0 /100 | #191 | Fair 5.2% |
| Sioux | 30.8 /100 | #192 | Fair 5.2% |
| Immigrants | Africa | 29.6 /100 | #193 | Fair 5.2% |
| Argentineans | 29.1 /100 | #194 | Fair 5.2% |
| Costa Ricans | 27.0 /100 | #195 | Fair 5.2% |
| Immigrants | Poland | 24.3 /100 | #196 | Fair 5.2% |
| Guamanians/Chamorros | 22.5 /100 | #197 | Fair 5.2% |
| Maltese | 19.6 /100 | #198 | Poor 5.2% |
| Immigrants | Europe | 19.0 /100 | #199 | Poor 5.2% |
| Immigrants | Pakistan | 18.4 /100 | #200 | Poor 5.2% |
| Laotians | 18.1 /100 | #201 | Poor 5.2% |
| Immigrants | Northern Africa | 17.7 /100 | #202 | Poor 5.2% |
| Sub-Saharan Africans | 17.1 /100 | #203 | Poor 5.2% |
| Immigrants | China | 16.9 /100 | #204 | Poor 5.2% |
Demographics Similar to Guyanese by Unemployment Among Seniors over 65 years
In terms of unemployment among seniors over 65 years, the demographic groups most similar to Guyanese are Zimbabwean (5.6%, a difference of 0.050%), Immigrants from West Indies (5.6%, a difference of 0.090%), Yaqui (5.5%, a difference of 0.21%), Cheyenne (5.5%, a difference of 0.22%), and Cape Verdean (5.5%, a difference of 0.22%).
| Demographics | Rating | Rank | Unemployment Among Seniors over 65 years |
| Belizeans | 0.0 /100 | #292 | Tragic 5.5% |
| Immigrants | Venezuela | 0.0 /100 | #293 | Tragic 5.5% |
| Armenians | 0.0 /100 | #294 | Tragic 5.5% |
| Cheyenne | 0.0 /100 | #295 | Tragic 5.5% |
| Cape Verdeans | 0.0 /100 | #296 | Tragic 5.5% |
| Yaqui | 0.0 /100 | #297 | Tragic 5.5% |
| Immigrants | West Indies | 0.0 /100 | #298 | Tragic 5.6% |
| Guyanese | 0.0 /100 | #299 | Tragic 5.6% |
| Zimbabweans | 0.0 /100 | #300 | Tragic 5.6% |
| Hispanics or Latinos | 0.0 /100 | #301 | Tragic 5.6% |
| Guatemalans | 0.0 /100 | #302 | Tragic 5.6% |
| Immigrants | Latin America | 0.0 /100 | #303 | Tragic 5.6% |
| Liberians | 0.0 /100 | #304 | Tragic 5.6% |
| Mexicans | 0.0 /100 | #305 | Tragic 5.6% |
| Ecuadorians | 0.0 /100 | #306 | Tragic 5.6% |